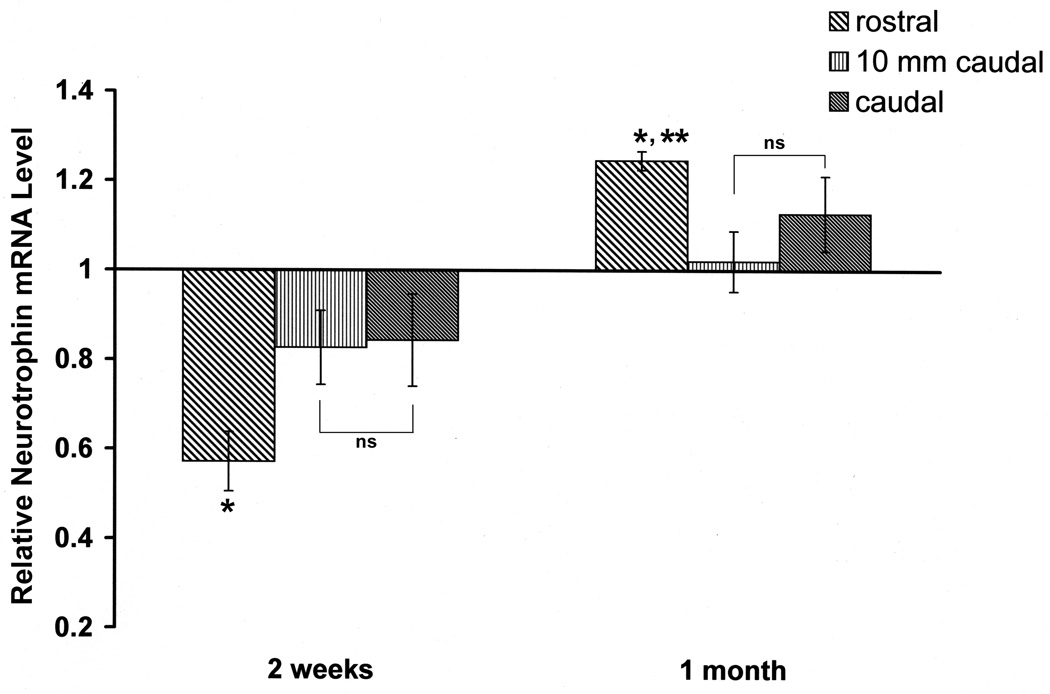
Figure 3. Relative changes of mRNA expression of NT post-transection in spinal cord rostral to the lesion (including the transection site), the first 10 mm caudal to the transection, and further caudal tissue.
The time course of relative changes of mRNA expression in spinal cord after injury was determined by quantitative real-time RT–PCR. The level of NT mRNA expression was calculated after normalizing against the GADPH mRNA level in each sample and is presented as the fold-difference in the level of NT mRNA expression after transection compared with the untransected control sample, which was assigned a value of 1. Significantly different: * rostral vs 10 mm caudal 2 weeks - P < 0.001; * rostral vs caudal 2 weeks - P < 0.001; * rostral vs 10 mm caudal 1 month - P < 0.001; ** rostral vs caudal 1 month - P <0.05; non-significantly (ns) different: 10 mm caudal vs caudal - P > 0.05.

