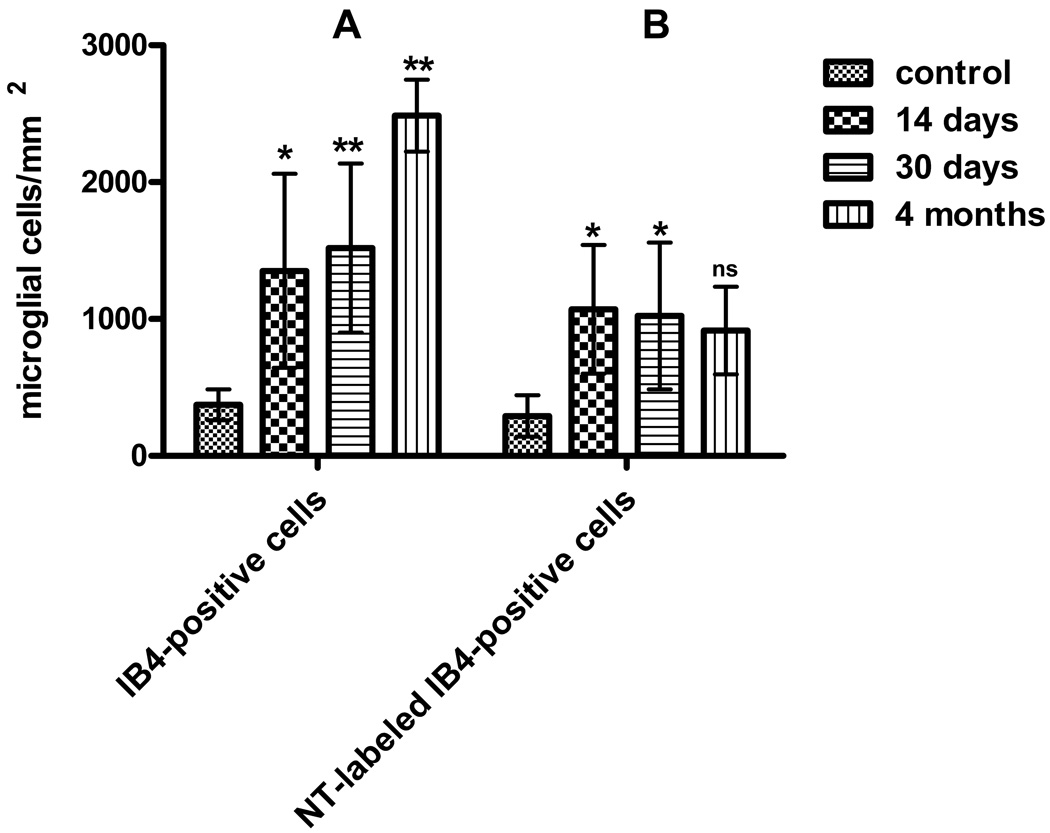
Figure 6. Microglial proliferation and NT expression in response to spinal cord transection.
A, Increase in the number of isolectin B4 -labeled microglial cells in the spinal cord between 0.5 and 5 mm rostral and caudal to the lesion site at 14, 30 days and 4 months post-lesion. P-values are indicated as follows: * P < 0.05 and ** P < 0.001 compare to control. Differences between 14 days and 30 days numbers are not significant. Differences between 14 days and 4 months and between 30 days and 4 months numbers are significant(P<0.01). B. NT expression in microglial cells post-transection. The numbers of NT-expressing microglial cells at 2, 4 weeks and 4 months post-transection are compared between control and lesioned spinal cord between 0.5 and 5 mm rostral and caudal to the lesion site. Control vs. 2 weeks: * P<0.05; control vs. 4 weeks: P<0.05; control vs. 4 months: P>0.05, ns, not significant; 2 weeks vs. 4 weeks: P>0.05, ns, not significant. Differences between 14 days and 4 months and between 30 days and 4 months numbers are not significant. Data are presented as means and standard deviations and analyzed using a two way ANOVA followed by a Bonferroni post-test.

