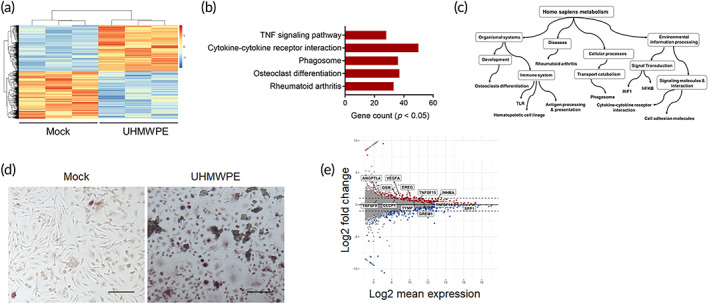
FIGURE 1.

Stimulation macrophages by UHMWPE particles induced osteoclast differentiation. (a) Heat map of regulated genes in macrophages that were stimulated with UHMWPE particles for 24 h (n = 3). Log2 fold change >1.0. A scale bar for intense color change from −1 or below indicated by blue color and 1 or above indicated by red. (b) KEGG pathways enrichment analysis of upregulated genes in response to UHMWPE particles stimulation. (c) Acyclic graph for NET‐work‐based gene enrichment of the enriched KEGG pathways (p ≤ 1e−07). (d) Representative images for TRAP‐stained macrophages stimulated with UHMWPE particles. Arrows indicate osteoclasts. Scale bars represent 100 μm. (e) MA plot analysis for transcript expression levels of significantly up‐ or downregulated genes in stimulated macrophages. Selected targeted molecules are indicated
