FIGURE 3.

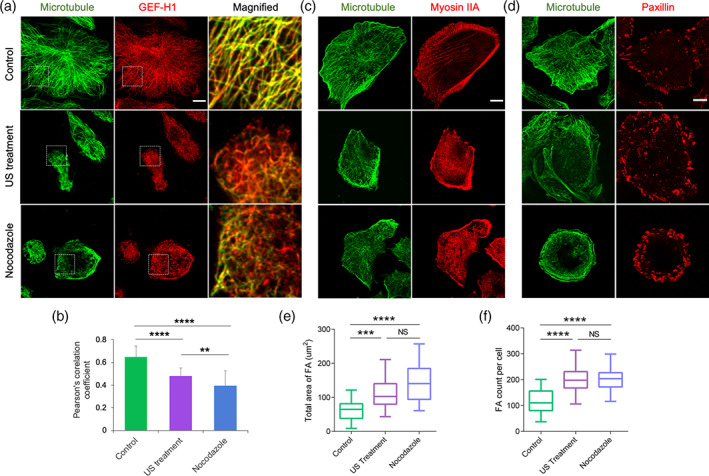
Ultrasound promotes GEF‐H1 release, myosin‐IIA assembly, and adhesion size. (a) Immunofluorescent images showing spatial distribution of microtubules and GEF‐H1 in the control, ultrasound‐ and nocodazole‐treated MDA‐MB‐231 tumor cells. (b) Pearson's correlation coefficient displaying the extent of microtubule and GEF‐H1 colocalization under different experimental condition, n = 25 cells from two independent experiments. (c) Representative images showing spatial distribution of microtubules and myosin IIA in the control, ultrasound‐ and nocodazole‐treated cells. (d) Representative images displaying microtubules and paxillin in the control, ultrasound‐ and nocodazole‐treated cells. (e,f) Box‐and‐whisker plot indicating total area of adhesions per cell and number of adhesions per cell respectively in the control, ultrasound‐ and nocodazole‐treated cells, n = 25 cells. Whiskers extend from the minimum to maximum values, the box extends from the 25th to the 75th percentile and the line within the box represents the median. **p < 0.01, ***p < 0.001, ****p < 0.0001. In all image panels, scale bar: 10 μm
