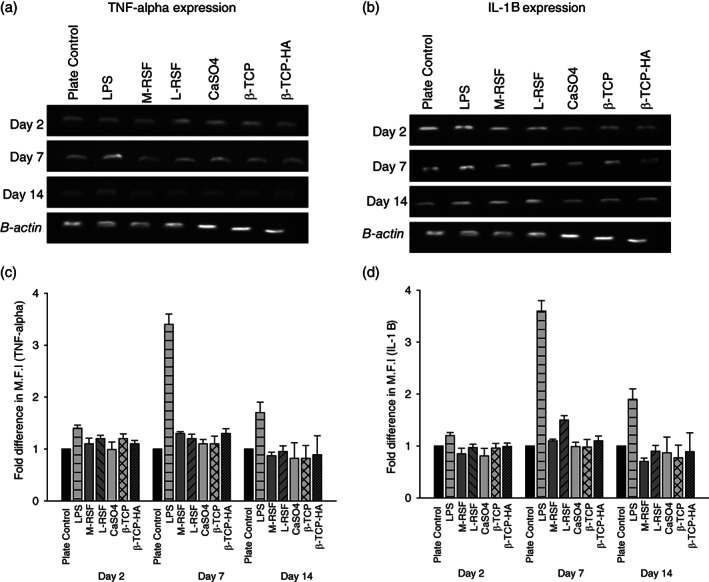
FIGURE 3.

Assessment of inflammatory response: RAW 264.7 cells were cultured in presence of scaffolds for 14 days at 37°C in 5% CO2 atmosphere. Inflammatory response was assessed at Days 2, 7, and 14 by measuring expression levels of tumor necrosis factor alpha (TNF‐α) and interleukin 1 beta (IL‐1β). Cells treated with lipopolysaccharide (LPS) (1 mg/ml) and untreated wells were used as positive and negative controls, respectively. At time points Days 2, 7, and 14 mRNA were extracted from cells, converted into cDNA and amplified using TNF‐α and IL‐1β specific primers. Panels (a) and (c) show reverse transcriptase polymerase chain reaction (RT‐PCR) gel image of TNF‐α and IL‐1 β, respectively. (b) and (d) are densitometric analysis of band intensities of TNF‐α and IL‐1 β expression, was done by Image J software. Fold difference in mean fluorescence intensity (M.F.I.) was plotted
