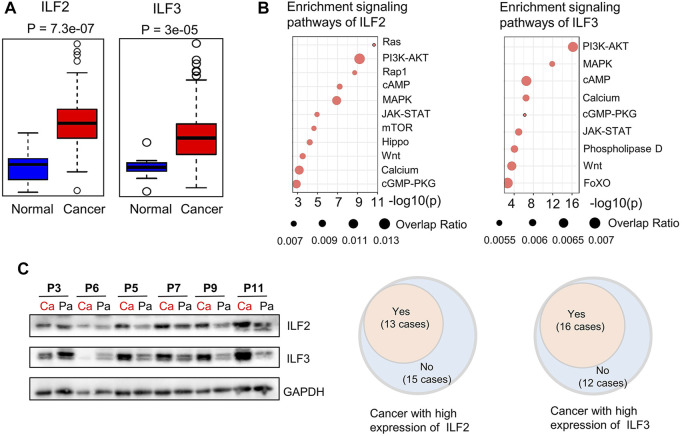
FIGURE 4.
Bioinformatic analysis of ILF2 and ILF3 related with ESCC and Western blot analysis of ILF2 and ILF3 in 28 cases. (A). Gene-expression analysis of ILF2 and ILF3 in EC according to public databases [n (cancer) = 182; n (normal) = 286]. (B). Prediction of signaling pathways possibly affected by ILF2 and ILF3 in ESCC. (C). Western blot analysis of ILF2 and ILF3 expression in 28 ESCC cases. GAPDH was used as a loading control in shown Western blot strips of representative 6 cases. (Ca indicated cancer tissues; Pa indicated para-cancer tissues.)

