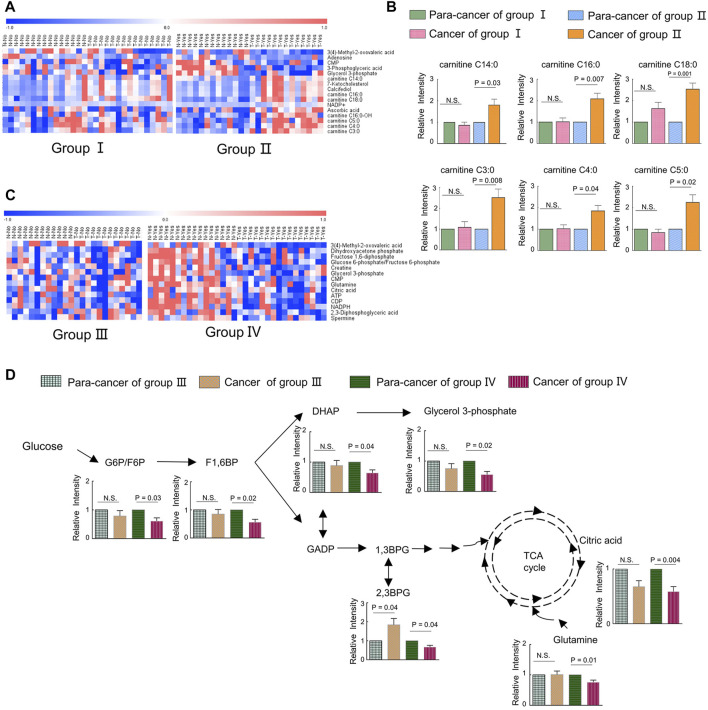
FIGURE 5.
Metabolic adaptions related with a highly expressed ILF2 and ILF3 in ESCC. (A). Heatmap analysis of differential metabolites according to the expression of ILF2 in ESCC tissues. Patients in group Ⅱ exhibited higher ILF2 levels in tumor tissues than those in the para-tumor tissues, and other cases were in group Ⅰ. (B). Alterations of acyl-carnitines in ESCC cases with (n = 13, group Ⅱ) or without (n = 15, group Ⅰ) highly expressed ILF2 in tumor tissues. (C). Heatmap analysis of differential metabolites according to the expression of ILF3 in ESCC tissues. Patients in group Ⅳ exhibited higher ILF3 levels in tumor tissues than those in the para-tumor tissues and others were in group Ⅲ. (D). Influenced glycolysis pathway in ESCC cases with (n = 16, group Ⅳ) or without (n = 12, group Ⅲ) highly expressed ILF3 in tumor tissues. Data were expressed as mean ± SEM.

