FIGURE 2.

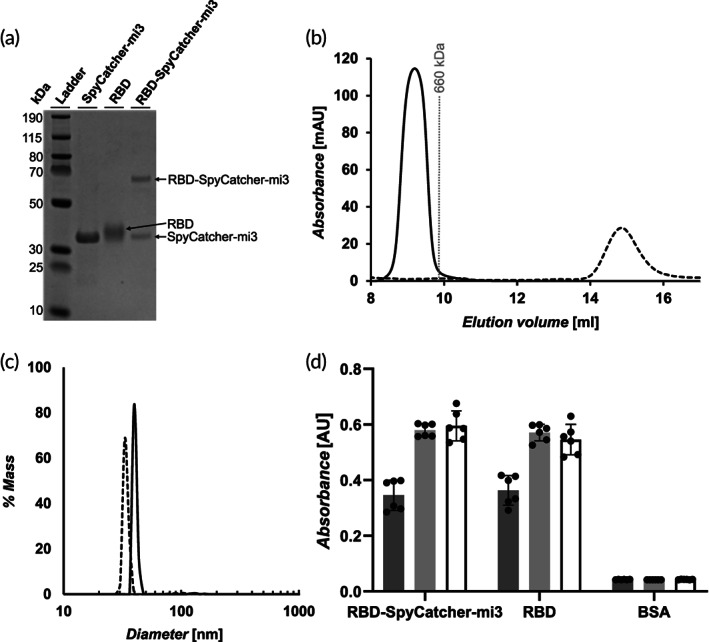
Characterization of receptor‐binding domain (RBD) and RBD‐SpyCatcher‐mi3. (A). Characterization of SpyCatcher‐mi3, RBD, and RBD‐SpyCatcher‐mi3 by SDS‐PAGE. The unprocessed gel is shown in Figure S3. (B). Size exclusion chromatography curves for RBD (dashed line) and RBD‐SpyCatcher‐mi3 (solid line). The gray line represents the peak elution volume of the molecular weight standard thyroglobulin. The column void volume is 7.2 ml. (C). Characterization of the RBD‐SpyCatcher‐mi3 (solid line) and SpyCatcher‐mi3 (dashed line) by dynamic light scattering. (D). Characterization of the binding of ACE‐2‐Fc (dark gray), CR3022 (light gray), and S309 (white) to RBD, RBD‐SpyCatcher‐mi3, and BSA (control) by enzyme‐linked immunosorbent assay (ELISA) (mean ± SD, n = 6: two assays with three technical replicates)
