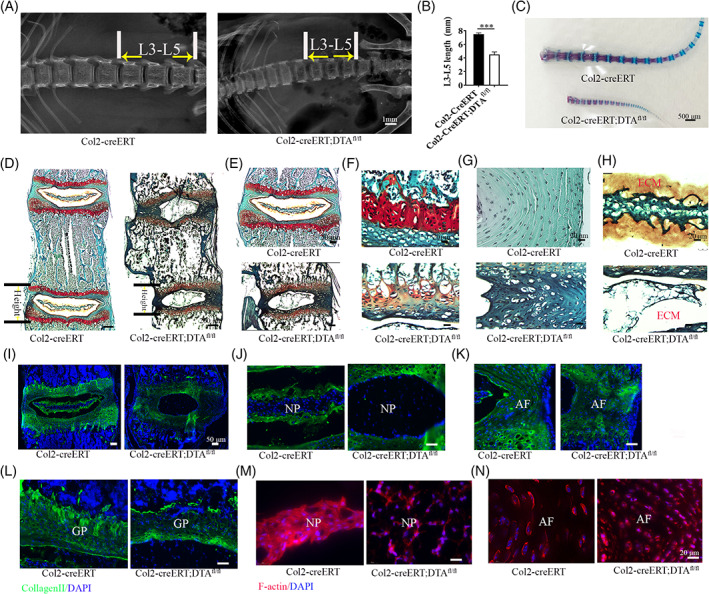
FIGURE 2.

Postnatal deletion of Col2+ cells disrupt the pattern of spine. A, X‐ray of spine in 4‐week‐old Col2‐creERT and Col2‐creERT;DTAfl/fl mice. Scale bar = 1 mm. B, The quantity analysis of mice L3‐L5 length of (A) (n = 6 mice per condition from three independent experiments). Data are mean ± SD. C, Alizarin red and Alcian blue staining for the tail from the 4‐week‐old Col2‐creERT and Col2‐creERT;DTAfl/fl mice. Scale bar = 500 μm. D, Safranin O/fast green staining of coronal sections of L4‐5 spine in 4‐week‐old Col2‐creERT and Col2‐creERT;DTAfl/fl mice. Scale bar = 200 μm. E‐H, High magnification pictures showing growth plate (GP), AF, and NP in 4‐week‐old Col2‐creERT and Col2‐creERT;DTAfl/fl mice. Scale bar = 20 μm. I, Immunofluorescence staining for Col2α1 in intervertebral disc (IVD) of 4‐week‐old Col2‐creERT and Col2‐creERT;DTAfl/fl mice. Scale bar = 50 μm. J‐L, High magnification immunofluorescence pictures showing Col2α1 protein expression in NP, AF, and GP from 4‐week‐old Col2‐creERT and Col2‐creERT;DTAfl/fl mice. M,N, Phalloidin staining show the cytoskeleton of NP and AF in 4‐week‐old Col2‐creERT and Col2‐creERT;DTAfl/fl mice. Statistical significance was determined by one‐way ANOVA and Student's t test. *P < .05, **P < .01, ***P < .0001. NS, not statistically significant. Scale bar = 20 μm
