
FIGURE 3.
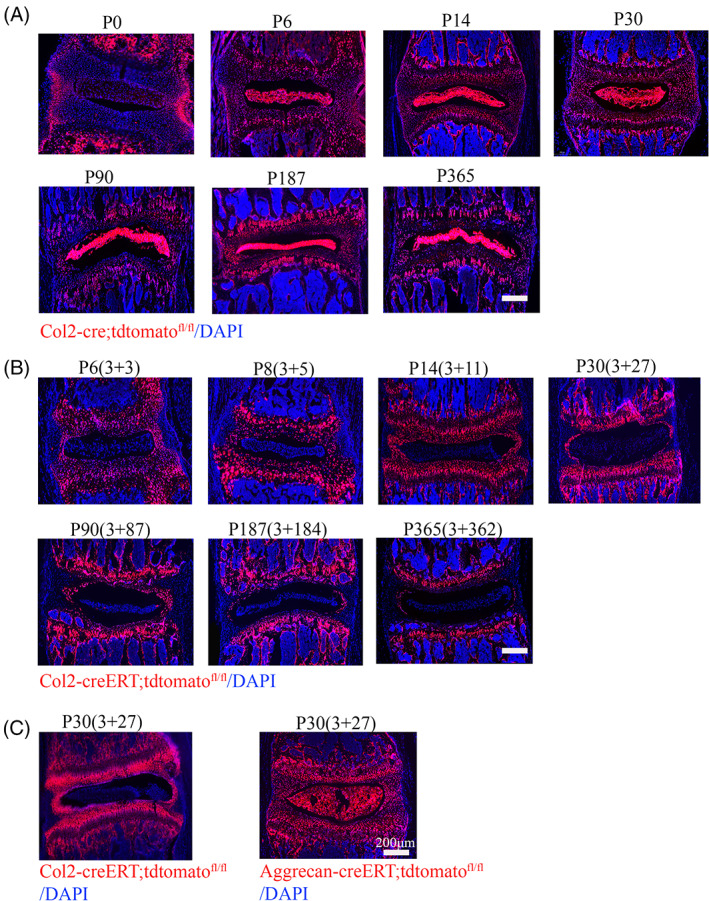
Spatial distribution of embryonic and postnatal Col2+ cells in the mouse intervertebral disc (IVD) and vertebral bone. A, Representative images from lineage tracing of embryonic Col2+ cells in IVD at different time point (P0, P6, P14, P30, P90, P187, and P365) in Col2‐cre;tdTomato mice. Six mice evaluated in each group. B, Representative images from lineage tracing of Col2 + cells in IVD at different time point (P6, P8, P14, P30, P90, P187, and P365) in Col2‐creERT;tdTomato mice. Tamoxifen (75 mg TM/kg body weight) were i.p. injected into P3 mice. Six mice evaluated in each group. C, Representative images from lineage tracing tdTomato+ cells in IVD from Col2‐creERT;tdTomato and Aggrecan‐creERT;tdTomato mice at P30. Tamoxifen (75 mg TM/kg body weight) were i.p. injected into P3 mice. Six mice evaluated in each group. Scale bar = 200 μm