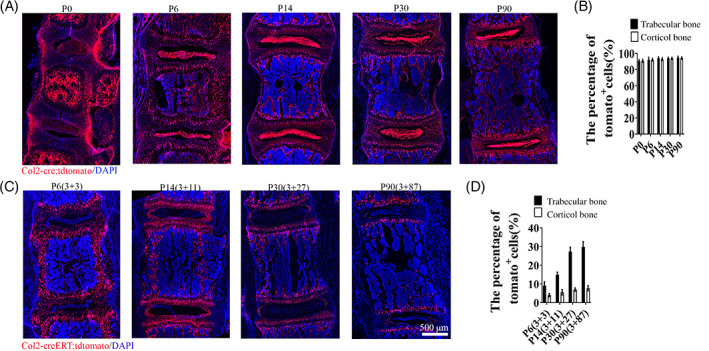
FIGURE 4.

Lineage tracing Col2+ cells in spine and intervertebral disc (IVD) at different time points. A, Lineage tracing Col2+ cells in spine and IVD at P0, P6, P14, P30, and P90 in Col2‐cre;tdTomato mice. (Since all the Col2+ cells activated from embryonic stage Col2‐cre;tdTomato mice, we only include the date for harvesting mice sample in each group. For example, P6 means: in Col2‐cre;tdTomato mice, the date for harvest is P6.) B, Quantitative measurements of the percentage of tdTomato+ cells to the total DAPI+ cells in (A) (n = 6 mice per condition from three independent experiments). Data are mean ± SD. C, Lineage tracing Col2+ cells in spine and IVD at P6, P14, P30, and P90 in Col2‐creERT;tdTomato mice. Tamoxifen (75 mg TM/kg body weight) were i.p. injected into P3 mice. Six mice evaluated in each group. (The data presented: harvest time (tamoxifen injected date + the tracing time.) For example, P6 (3 + 3) means: in Col2‐creERT;tdTomato mice, the date for harvest is P6 (TM injected date is P3 and tracing for 3 days). D, Quantitative measurements of the percentage of tdTomato+ cells to the total DAPI+ cells in (C) (n = 6 mice per condition from three independent experiments). Data are mean ± SD. Statistical significance determined by one‐way ANOVA and Student's t test. *P < .05, **P < .01, ***P < .0001. NS, not statistically significant. Scale bar = 500 μm
