
FIGURE 5.
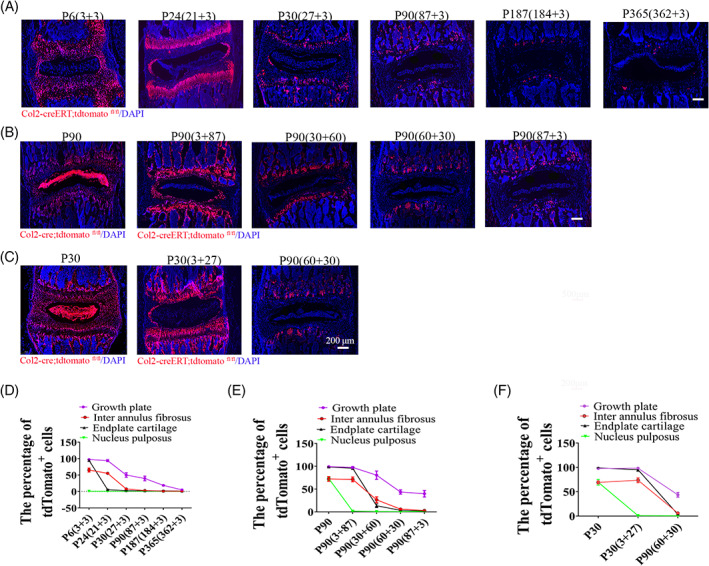
The decreased numbers and differentiation ability of Col2+ progenitors during aging. A, Lineage tracing of postnatal Col2+ cells for 3 days in each component of intervertebral disc (IVD) which activated at different time points (P3, P21, P27, P87, P184, and P362). 75 mg/kg tamoxifen were i.p. injected into mice at above indicated different time points. The mice were harvested at day 3 following TM injection. B, Lineage tracing of Col2+ cells in IVD at P90, which was activated at different time points (since embryo, P3, P30, P60, and P87). C, Lineage tracing Col2+ cells in IVD for 1 month while activated at different time point (since embryo, P3, P60). 75 mg/kg tamoxifen were i.p. injected into mice at above indicated different points. D, Quantitative measurements of the percentage of tdTomato+ cells to the total DAPI+ cells in (A) (n = 6 mice per condition from three independent experiments). Data are mean ± SD. E, Quantitative measurements of the percentage of tdTomato+ cells to the total DAPI+ cells in (B) (n = 6 mice per condition from three independent experiments). Data are mean ± SD. F, Quantitative measurements of the percentage of the cells with tdTomato+ to the total DAPI+ cells per view of (C) (n = 6 mice per condition from three independent experiments). Data are mean ± SD. The percentage calculation in each tissue were measured at least 1000 cells each sample. Statistical significance was determined by one‐way ANOVA and Student's t test. *P < .05, **P < .01, ***P < .0001. NS, not statistically significant. Scale bar = 200 μm