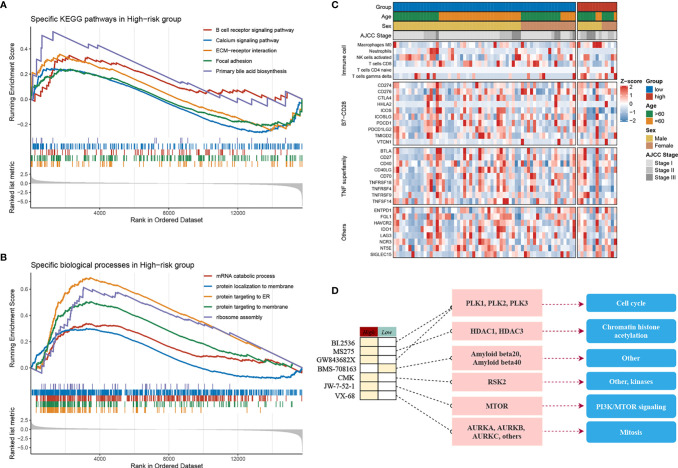
Figure 4.
Molecular landscape, immune landscape, and assessment of chemotherapy. (A, B) The GSEA analysis of the high- and low-risk groups. (A) The KEGG pathway enrichment analysis and (B) The biology process enrichment analysis. (C) The heatmap of the clinical- and immune-related molecular landscape. From the top to the end, there are five models, including clinical characteristics, immune cells, B7-CD28, TNF superfamily, and other immune-related molecular landscapes. (D) Molecular regulatory mechanism of the seven potential antitumour drugs. Left, the drug names and the level of sensitivity in each group; middle, the drug-targeted molecules; right, the drug-targeted pathways.

