
Figure 4.
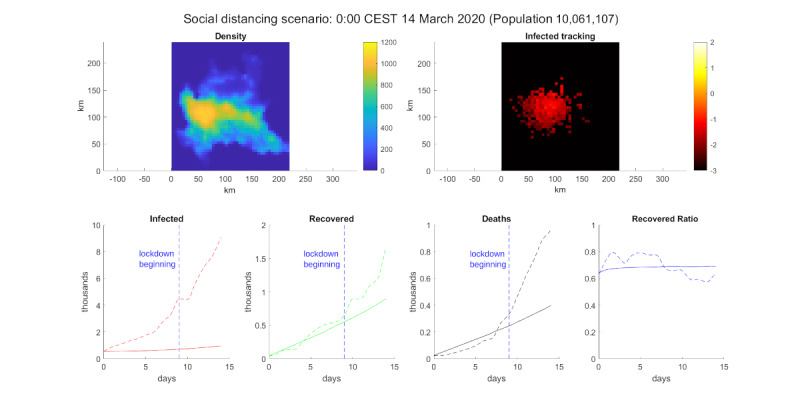
Social distancing simulation. Top-left: population density. Top-right: log10 of the infected percentage per cell. Bottom, from left to right: infected number, recovered number, deceased number, and recovered ratio (recovered/deaths). The solid line is the model simulation, the dotted line is extracted data from the Ministry of Health/Civil Protection Department [33] for Lombardy, and the vertical dotted blue line marks the date March 9, 2020 [32].