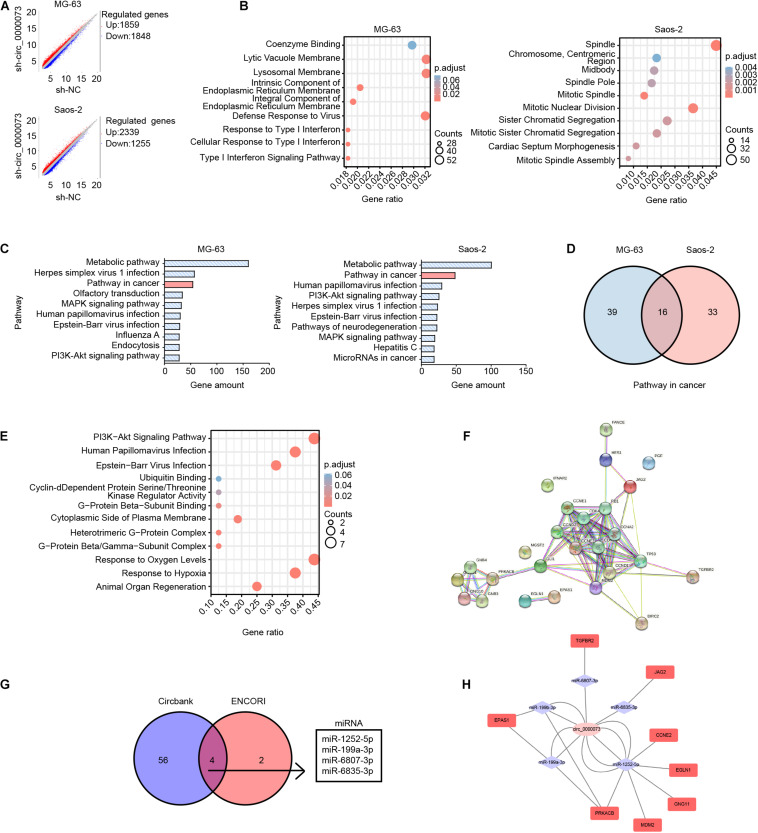
FIGURE 3.
Bioinformatics analysis of DEGs after hsa_circ_0000073 silencing. (A) Scatter plot of all DEGs between sh-NC group and sh- circ_0000073. (B) GO analyses showed enrichment of down-regulated DEGs. (C) KEGG pathways analysis of top 10 pathways. (D) Venn analysis revealed amount genes in “pathways in cancer” of two cell lines. (E) GO and KEGG analyses displayed enrichment of co-expressed DEGs. (F) PPI network analysis showed interaction of co-expressed DEGs as well as relational genes. (G) Databases predicted four miRNAs shared with hsa_circ_0000073. (H) ceRNA network displayed relationship among hsa_circ_0000073, miRNA, and target genes collected by co-expressed DEGs in “pathway in cancer.”

