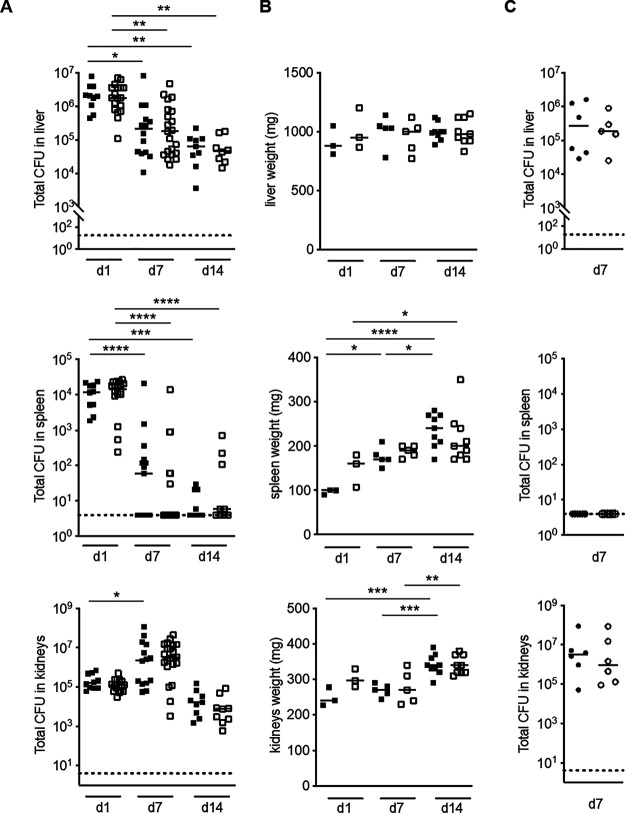
FIG 4.
EfΔFASII and BWT-FASII infection in a mouse septicemic model. (A) CFU shown by scatter graph plots at 1, 7, and 14 days postinfection (dpi) of bacteria recovered from BWT-FASII- and EfΔFASII-infected mice. Nine to 20 mice were intravenously infected with 6 × 10⁸ to 8 × 10⁸ CFU E. faecalis BWT-FASII (closed squares) or EfΔFASII (open squares) strains. (B) Organ weights shown by scatter graph plots at 1, 7, and 14 dpi of 3 to 9 mice infected by the EfΔFASII or BWT-FASII strains. Symbols are as in panel A. (C) CFU shown by scatter graph plots at 7 dpi of viable bacteria recovered from EfΔcfa- and BWT-cfa-infected mice. Six mice were intravenously infected with 6 × 10⁸ to 8 × 10⁸ CFU E. faecalis BWT-cfa (closed circles) or EfΔcfa (open circles) strains. Upper panels, liver; middle panels, spleen; lower panels, kidneys. Each symbol represents the number of CFU per organ of one infected mouse or the weight of one organ. Median ranges are represented. Statistical analysis was as follows: 2-way analysis of variance (ANOVA) and a Bonferroni posttest (A and B) Mann-Whitney test (C). *, P < 0.05; **, P < 0.01; ***, P < 0.005; ****, P < 0.0001.

