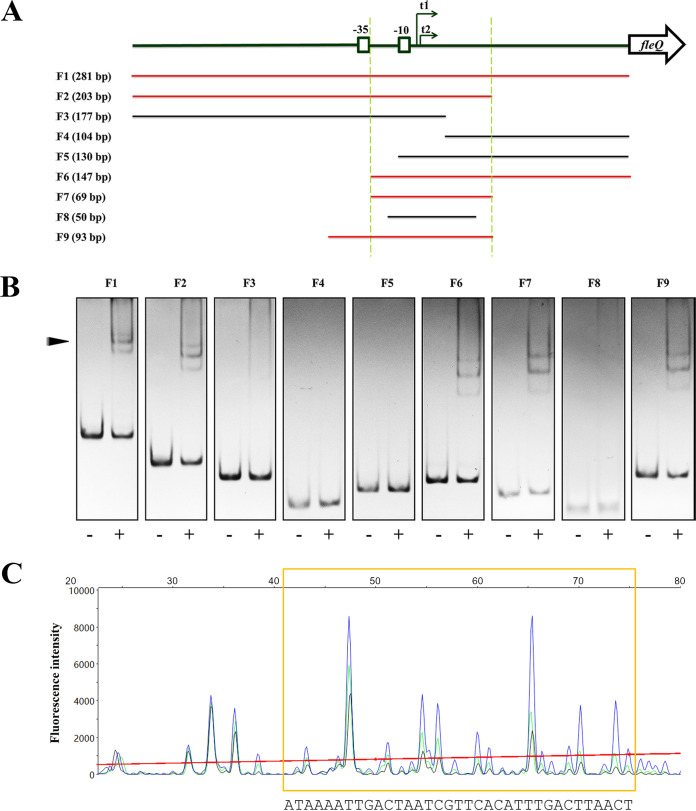
FIG 3.
Identification of the exact binding sites of OsaR in the fleQ promoter. (A) Schematic diagram of the fragments used for gel shift assays and DNase I footprinting assays. The fleQ gene is represented by an open arrow. The −35 and −10 boxes of the fleQ promoter are boxed. The two transcription start sites, t1 and t2, are indicated by two arrows. The designation and length of each of the fragments, F1 to F9, are shown on the left; red and black colors indicate shift or no shift, respectively. The overlaps of F2 and F6 are defined between the two dashed lines. (B) Gel shift assays of OsaR and DNA fragments F1 to F9. The protein-DNA complex is indicated by an arrowhead. DNA fragments of 100 ng were used and incubated with (+) or without (−) OsaR at a concentration of 40 nM. All fragments were assayed on 5% polyacrylamide gels. F1 to F3, F4 to F6, and F7 to F9 were assayed on independent gels by electrophoresis for 1 h 50 min, 1 h 35 min, and 1 h 20 min, respectively. (C) A DNase I footprinting assay revealed the OsaR binding site. 5′-FAM-labeled DNA fragment F9 (500 ng) was incubated with 80 nM (black), 40 nM (green), or 0 nM OsaR (blue) and then submitted to a 1-min DNase I treatment (0.5 U) and analyzed by capillary electrophoresis. The fluorescence intensity (arbitrary units, ordinate) is plotted against the sequence length (bases, abscissa) of the fragment. Peaks are superimposed, and the differentiated region of the three electropherograms is marked by a yellow box.

