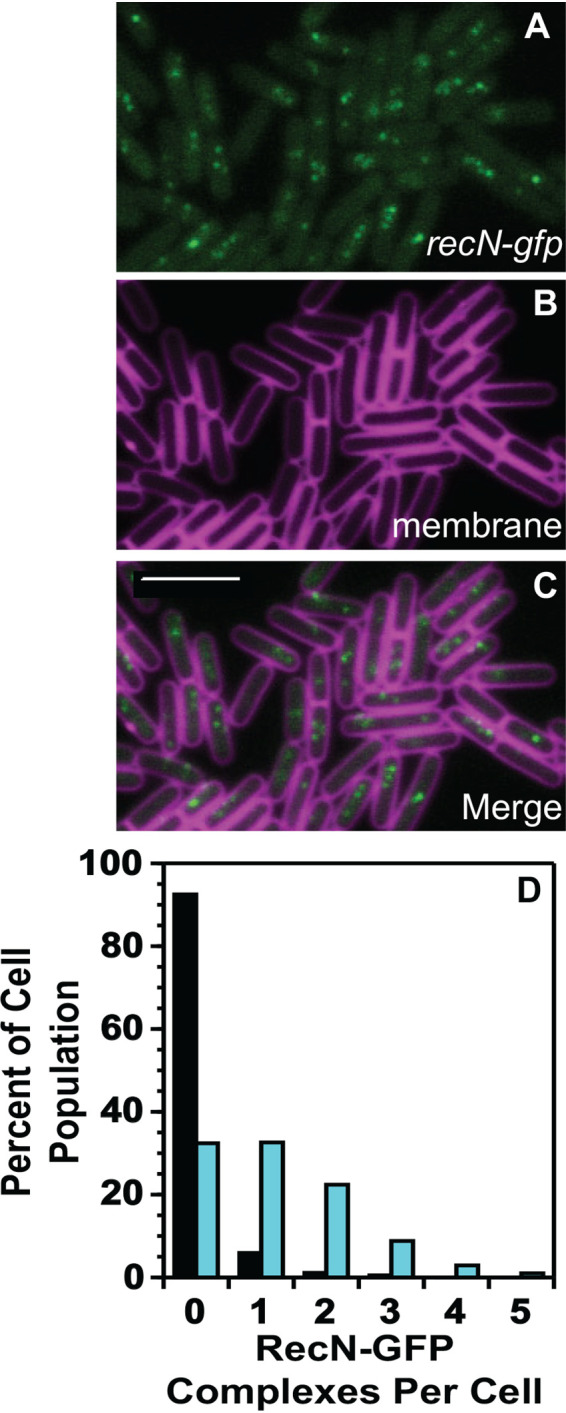
FIG 4.

RecN-GFP forms multiple repair complexes on the nucleoid per cell. (A to C) Representative images of RecN-GFP foci, the cell membrane imaged with TMA-DPH pseudocolored magenta, and the merged imaged. The bar indicates 4 μm. (D) Number of foci per cell for untreated cells (black bars) and cells challenged with mitomycin C (cyan bars). The number of cells scored for untreated and mitomycin C treatment were over 900 cells per condition.
