
FIGURE.
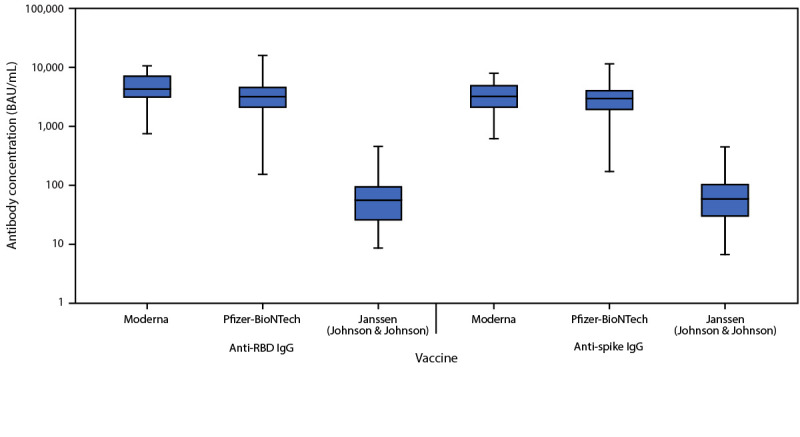
Serum anti–receptor binding domain and anti-spike immunoglobulin G levels 2–6 weeks after full vaccination among healthy adult volunteers — three hospitals in three U.S. states,*,† April–June 2021
Abbreviations: BAU = binding antibody units; IgG = immunoglobulin G; IQR = interquartile range; RBD = receptor binding domain.
* Anti-RBD and anti-spike IgG levels were measured in sera of healthy volunteers 2-6 weeks after a second dose of the Moderna or Pfizer-BioNTech COVID-19 vaccine and the first dose of the Janssen COVID-19 vaccine. In these box and whisker plots, the central horizontal line of each box plot represents the median, with the box denoting the IQR, and the whiskers representing the minimum and maximum values. Two volunteers with anti-nucleocapsid IgG antibodies, indicative of a prior SARS-CoV-2 infection, were excluded from this analysis.
† Hospitals that recruited healthy adult volunteers included Beth Israel Deaconess Medical Center (Boston, Massachusetts), Vanderbilt University Medical Center (Nashville, Tennessee), and Wake Forest University Baptist Medical Center (Winston-Salem, North Carolina).