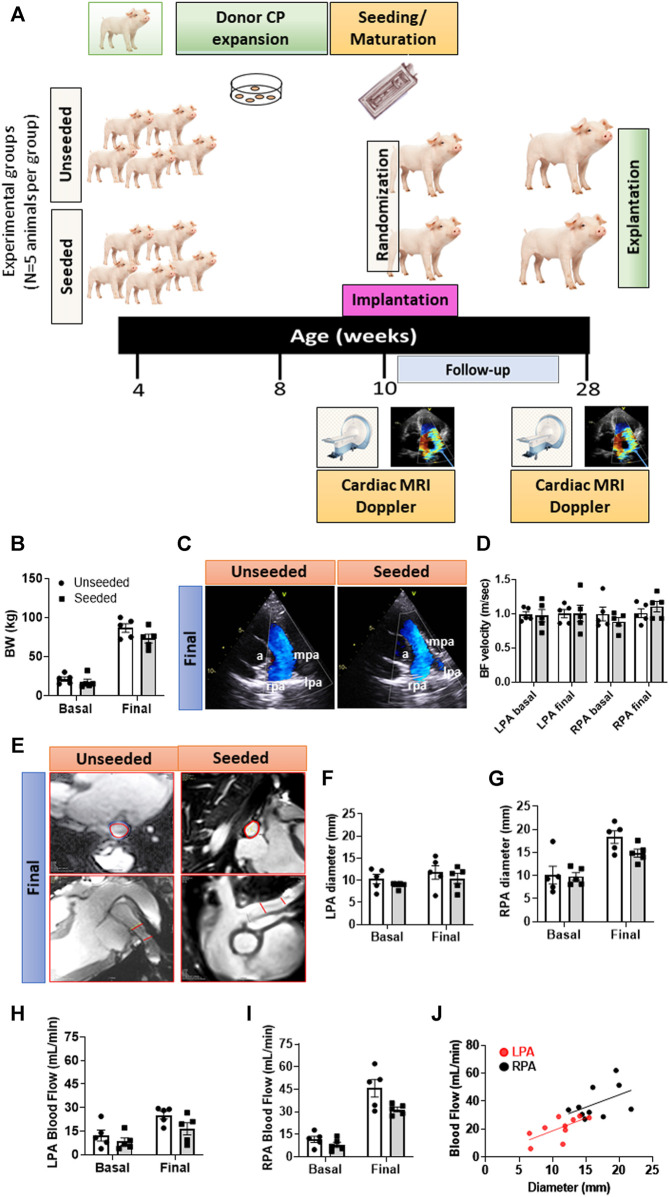
FIGURE 1.
General outcome and imaging endpoints of the randomized, controlled preclinical study. (A) Schematic of the study. (B) Body weight of animals randomized to the two groups. (C) Representative images of Doppler echocardiography. Vascular structures are highlighted in the images: a = aorta, lpa = left pulmonary artery, mpa = main pulmonary artery, rpa = right pulmonary artery. (D) Column graph and individual Doppler data in the two groups at baseline and 4-moths follow-up. (E) Representative images of the cardiac MRI showing transversal and longitudinal sections of the site of grant implantation delimited by the red lines. (F–I) Column graph and individual MRI data (diameter and blood flow) in the two groups at baseline and 4-months follow-up regarding the LPA (F,H) and RPA (G,I). (J) Correlation between diameter and blood flow regarding LPA and RPA. Abbreviations: BF = blood flow, BW = body weight. N = 5 biological replicates per experimental group. Data are expressed as mean ± SEM.

