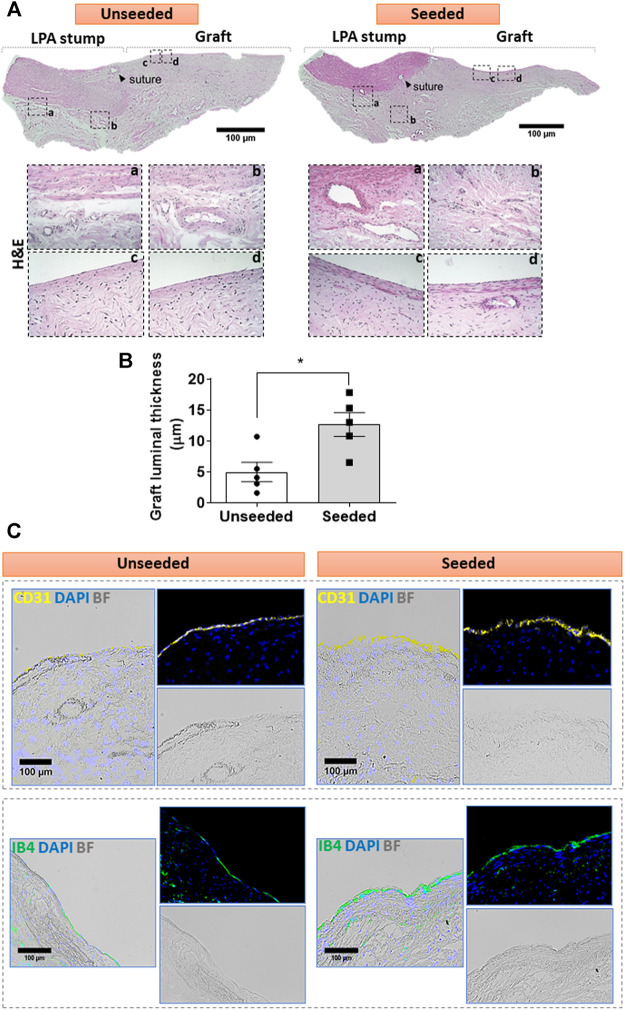
FIGURE 2.
Cellular composition of the graft: (A) H&E staining of unseeded and seeded grafts. Tiled images and inserts show the general architecture and details of explanted grafts, including the distribution of cells (cell nuclei are dark blue and eosinophilic compounds in the cytoplasm are pink) and the ECM underneath the luminal cell layer, containing fibroblasts and microvessels. (B) Bar graph showing the thickness of the luminal layer. N = 5 biological replicates per experimental group. Data are represented as mean ± SEM. *p < 0.05. (C) Immunofluorescent and bright-field images display the presence of CD31 (yellow) and IB4 (green) markers in the luminal endothelium of the grafts. Representative images are acquired using 2.5x, 10x, and 20x objectives.

