FIGURE 3.
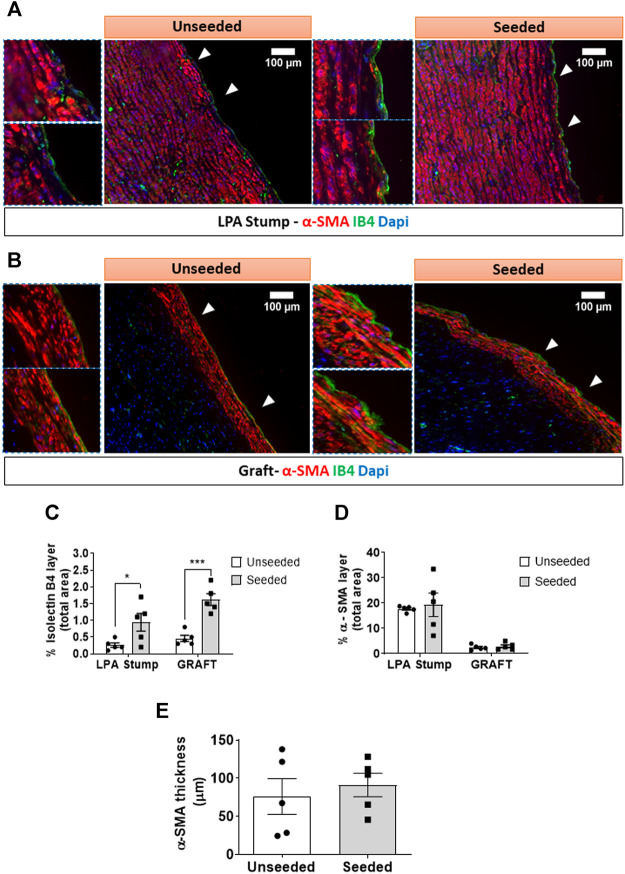
Multicolor fluorescent microscopy shows the luminal layer of the graft is composed of endothelial and smooth muscle cells. (A,B) Images showing the layer of luminal endothelial cells (green) sitting on several sheets of α-SMA + VSMCs (red) at the level of the LPA stump (A) and the grafts (B). Bar graphs showing the quantification of IB4 (C) and α-SMA staining measured as percentage of positive expression in the internal layer of total section area (D). α-SMA was also calculated as thickness layer expressed in μm (E). The images were visualized using a fluorescent microscope with 10x objectives and bigger inserts were added for better visualization of the details. N = 5 biological replicates per experimental group. Data are expressed as mean ± SEM. *p < 0.05, ***p < 0.0005.

