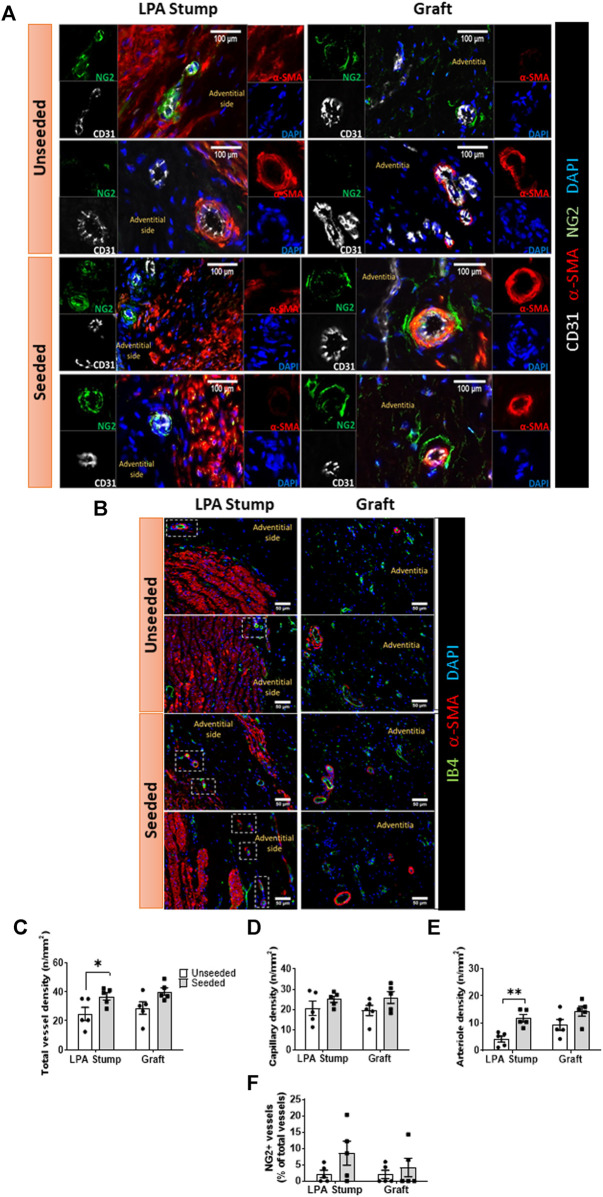
FIGURE 4.
Microvascular composition of the implanted artery. (A,B) Immunofluorescent microscopy image of the vascularization at the level of the LPA stump and grafts. In panel A, endothelial cells were stained with CD31 (white), vascular smooth muscle cells with a-SMA (red), pericytes with NG2 (green), and nuclei with DAPI (blue). In panel B, endothelial cells stained with IB4 (green), vascular smooth muscle cells with α-SMA (red), and nuclei with DAPI (blue). The location of the neo-adventitia is indicated in each image. Vascular smooth muscle cells are visualized in the tunica media of the LPA stump, the graft structure, and within intraparietal arterioles. (C–F) Bar graphs showing the vascular density and pericyte coverage in the two groups at the level of the LPA stump and grafts (C) Total vascular density, (D) Capillary density, (E) arteriole density, (F) NG2+ percentage. N = 5 biological replicates per experimental group. Data are expressed as mean ± SEM. *p < 0.05, **p < 0.01.

