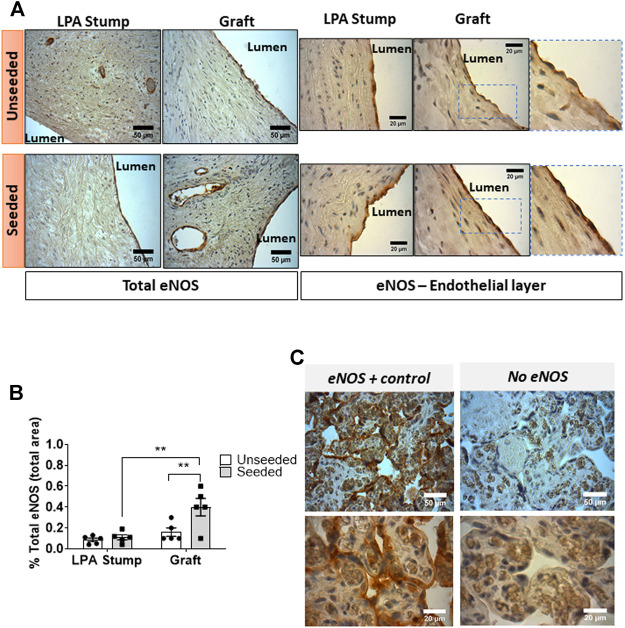
FIGURE 5.
Expression of eNOS expression in the implanted artery. (A) Light microscopy images displaying the expression of eNOS in the LPA stump and graft in the form of brown precipitates. An intense staining, continuous staining was detected in endothelial cells of the seeded grafts (both at the luminal side and in intraparietal microvessels) compared with unseeded grafts. Moreover, weak positive staining could be appreciated in muscular cells underneath the luminal endothelial cells of the seeded grafts. (B) Bar graph showing the quantification of eNOS staining measured as the percentage of total section area. Images were quantified using a light microscope with 40x and 100x objectives. N = 5 biological replicates per experimental group. Data are expressed as mean ± SEM. **p < 0.01 (C) Cross-sections of human placental villi (used as a positive control) show the strong expression of eNOS in the syncytiotrophoblasts.

