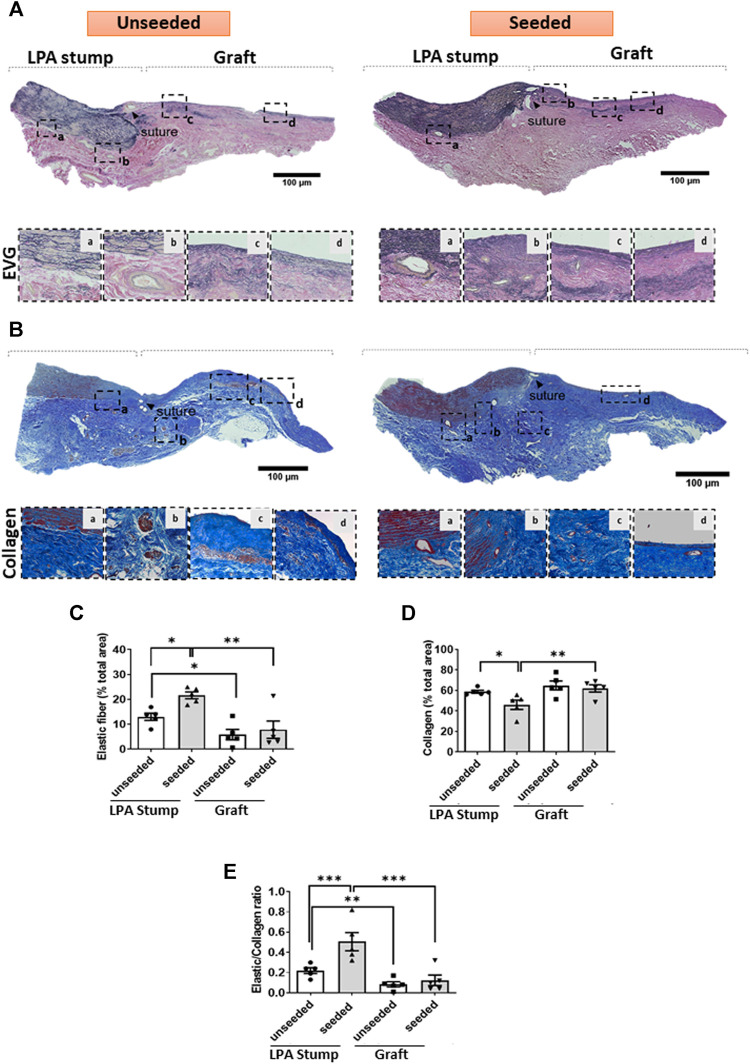
FIGURE 6.
ECM remodeling of the implanted artery. (A,B) Tiled images and inserts at higher magnification display the composition of elastic fibers of the LPA and graft, as assessed using EVG (A) and Azan Mallory (B) stainings. (C–E) Bar graphs showing the results of the quantification of elastin and collagen and their ratio. Images were visualized using a light microscope with 2.5x, 10x and 20x objectives. N = 5 biological replicates per experimental group. per experimental group. Data are expressed as mean ± SEM. *p < 0.05, **p < 0.01, and ***p < 0.001.

