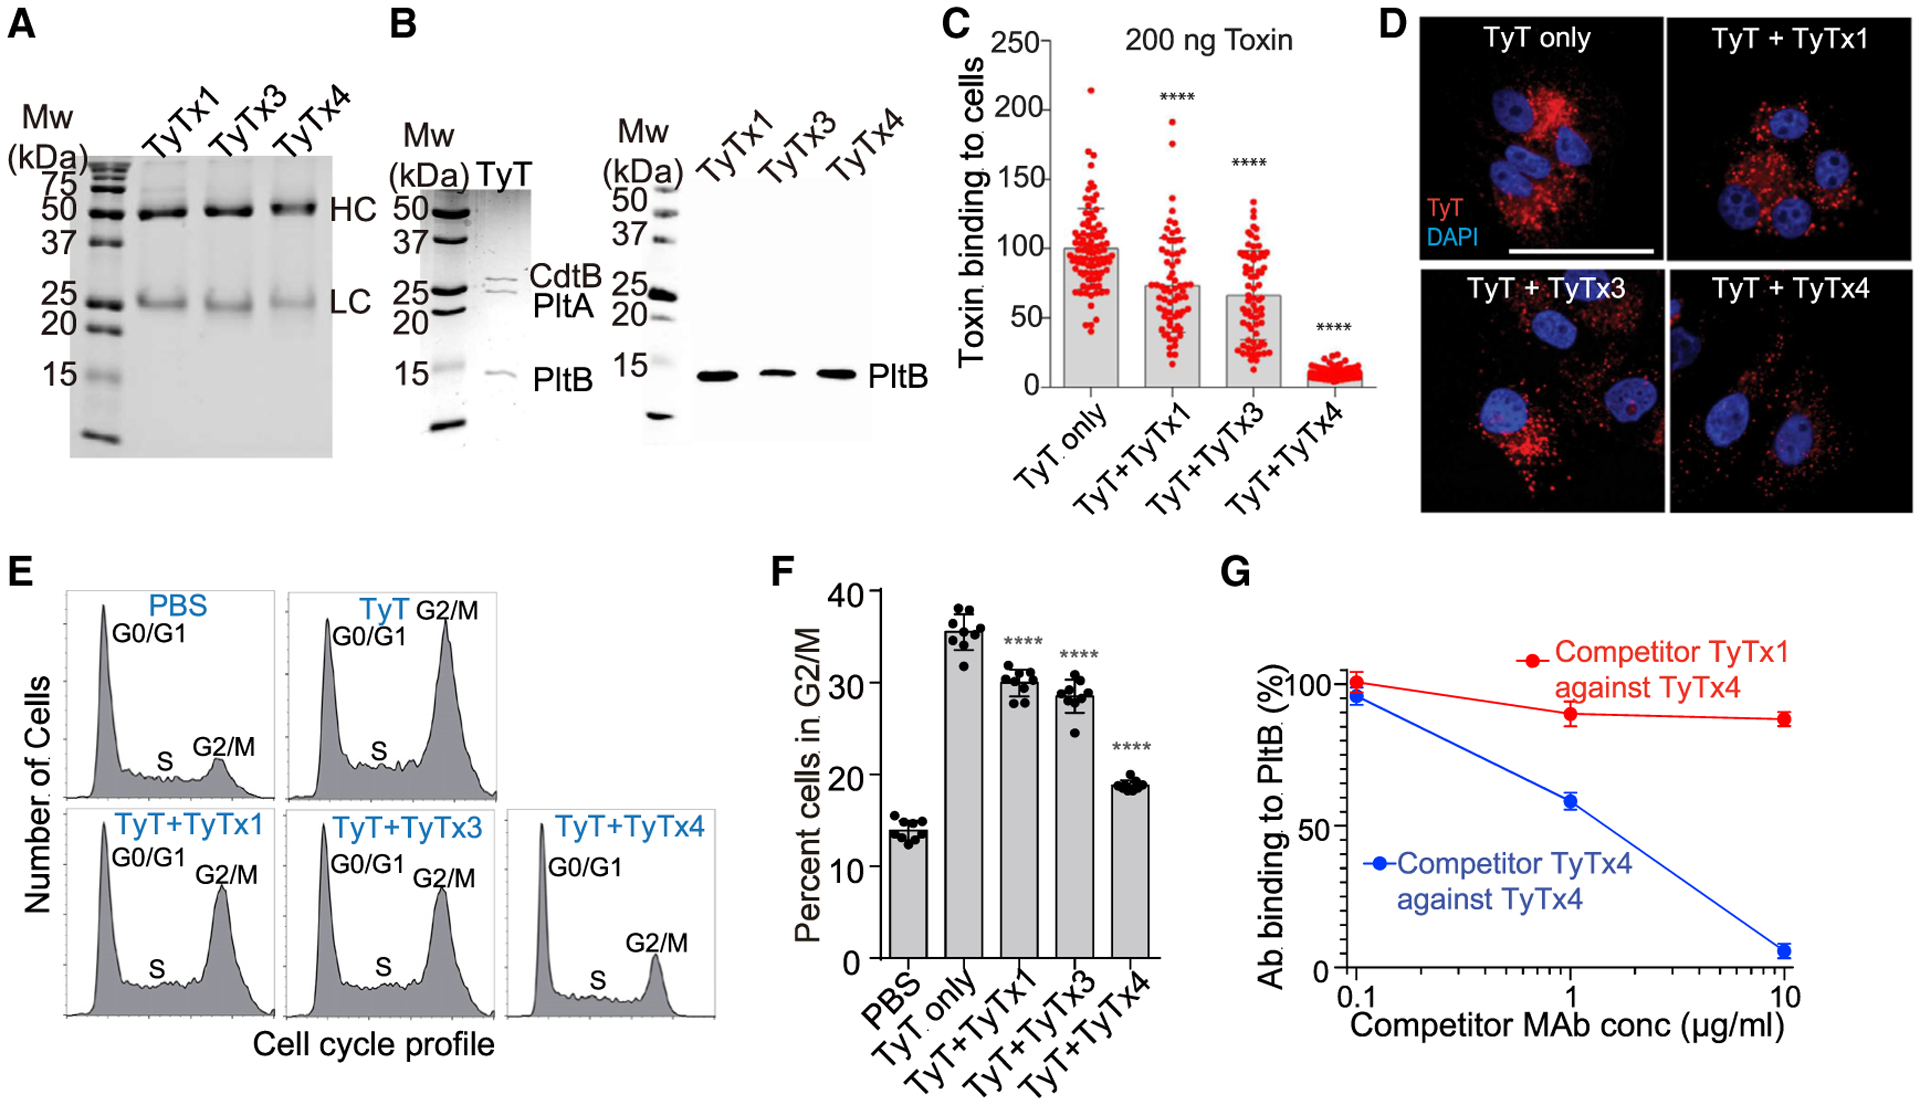
Figure 1. mAbs recognizing PltB subunits display different toxin neutralization efficacies.

(A) Purified mAbs were separated on SDS-PAGE and stained with Coomassie brilliant blue (CBB). HC, heavy chain. LC, light chain. Superdex 200 chromatograms of these purified mAbs are shown in Figure S1E.
(B) Typhoid toxins (200 ng) were separated on SDS-PAGE and stained with CBB (left panel), when indicated, followed by western blot analysis for each mAb to determine its binding subunits among the three subunits of the typhoid toxin (right panel). Three independent experiments were performed. Representative blot results are shown.
(C) Quantification of mAb-mediated inhibition of typhoid toxin binding to Henle-407 cells. Henle-407 cells grown on coverslips were precooled to 4°C, incubated with 200 ng of typhoid toxin-Alexa Fluor 555 (AF555) in the presence or absence of mAb for 30 min, counterstained with DAPI, and analyzed by fluorescence microscopy. Bars represent the mean ± standard error of the mean (SEM) obtained from three independent experiments. Each dot reflects the typhoid toxin signal intensity per image. n = 65–89. ****p < 0.0001, compared to the TyT-only group. Unpaired two-tailed t tests. Results conducted with 100 ng of typhoid toxin are shown in Figure S1F.
(D) Representative fluorescence microscopy images of Henle-407 cells incubated with 200 ng of typhoid toxin-AF555 with and without mAbs for 4 h. Henle-407 cells were pre-treated with media containing 10 mM NH4Cl for 20 min at 37°C, before chilling and binding of anti-typhoid toxin mAbs and fluorescent-labeled typhoid toxin. TyT, typhoid toxin (red); DAPI (blue), DNA. Scale bar, 10 μm.
(E and F) Jurkat cells were treated with purified typhoid toxin with and without mAbs for 18 h. Cell cycle profiles were analyzed via flow cytometry to assess the typhoid toxin-induced host cell cycle arrest in G2/M. (E) Representative cell cycle profiles of Jurkat cells treated with typhoid toxin with and without mAbs. (F) Percent of cells in the G2/M cell cycle from three independent experiments. Bars represent average ± SEM. ****p < 0.0001. n = 9 per group. Unpaired two-tailed t tests.
(G) Competition ELISA results between TyTx1 and TyTx4. TyTx4 (100 ng) immobilized on protein G ELISA plates was incubated with a mixture of 10 ng of biotinylated PltB pentamer and indicated doses of competitor mAbs. The graph shows the values for the mean ± SEM. Three independent experiments were performed.
See also Figures S1–S3 and Table S2.
