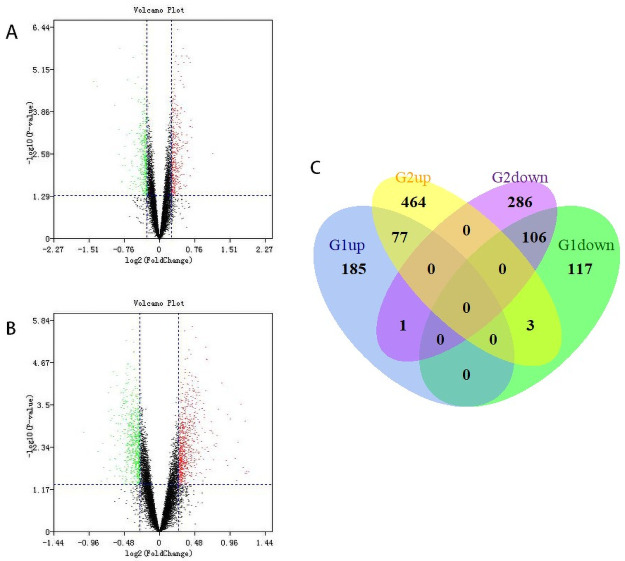
Fig 1. Identification of DEGs from GSE143272.
(A) Volcano plot of DEGs in the male dataset. (B) Volcano plot of DEGs in the female dataset. Red, upregulation; green, downregulation. (C) Venn diagram of upregulated and downregulated DEGs based on the male (G1) and female (G2) datasets.

