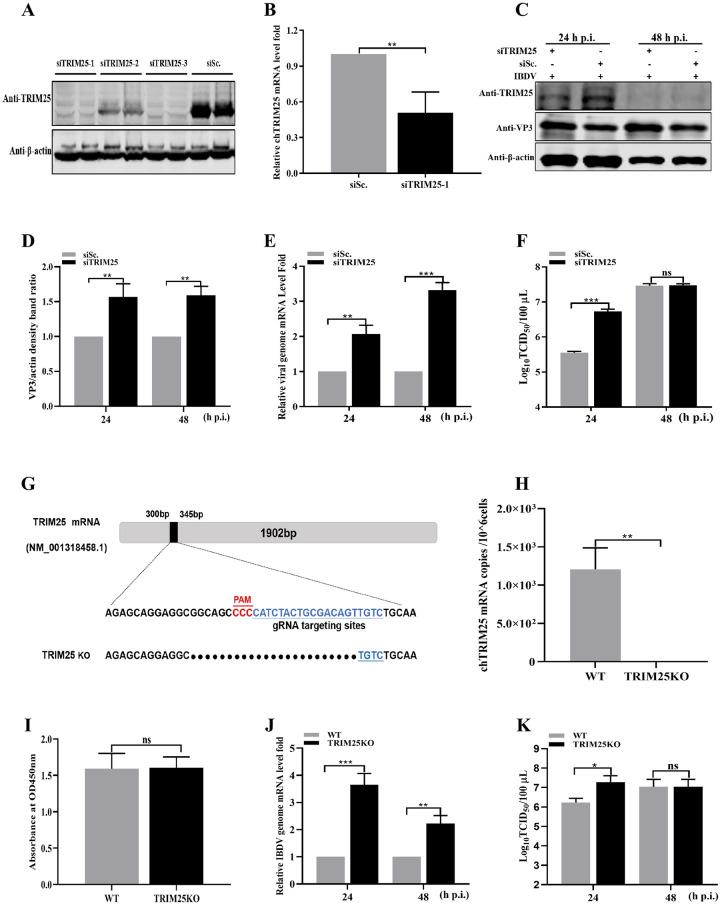
Fig 3. TRIM25 knockdown/knockout enhances IBDV replication.
(A-B) Validation of the optimal siRNA targeting TRIM25 by Western blotting (A) and RT-qPCR (B). (A) HEK293T cells were co-transfected with siRNAi (siTRIM25-1, siTRIM25-2, siTRIM25-3, and negative siRNA control siSc.) and pFlag-TRIM25, and the expression level of TRIM25 was determined using Western blotting. (B) DF-1 cells were transfected with siTRIM25-1, and the expression levels of endogenous TRIM25 were detected by RT-qPCR. (C-F) Influence of knockdown of TRIM25 on IBDV replication. The DF-1 cells were transfected with 2μg siTRIM25-1 or negative siRNA control siSc. for 24 h and subsequently were infected with IBDV at an MOI of 0.01 for 24 and 48 h, respectively. (C) Expression levels of TRIM25 and VP3 were determined by Western blotting. (D) Relative intensities of VP3 were normalized to β-actin. (E) Relative IBDV genome mRNA level in cell samples was quantified by RT-qPCR. (F) Released viral titers were detected and illustrated using a TCID50 assay. (G-I) Construction of TRIM25KO DF-1 cell line. (G) Sequence analysis of WT and TRIM25KO DF-1cell lines. (H) TRIM25 mRNA level of WT and TRIM25KO DF-1 cell lines. (I) Cell viability of WT and TRIM25KO DF-1 cell lines. (J-K) Influence of knockout of TRIM25 on IBDV replication. The WT and TRIM25KO DF1 cells were infected with IBDV at an MOI of 0.01 for 24 and 48 h, respectively. (J) IBDV genome mRNA level in WT and TRIM25KO DF-1 cell lines. (K) TCID50 in WT and TRIM25KO cell lines. All the qPCR results are represented as relative fold-change after being normalized to β-actin controls. The Western blotting results were representative of one of three independently performed. Three independent experiments were performed, and data are shown as mean ± standard deviations for triplicates from representative experiments. *, P < 0.05; **, P < 0.01; ***, P < 0.001; ns, no significant difference.

