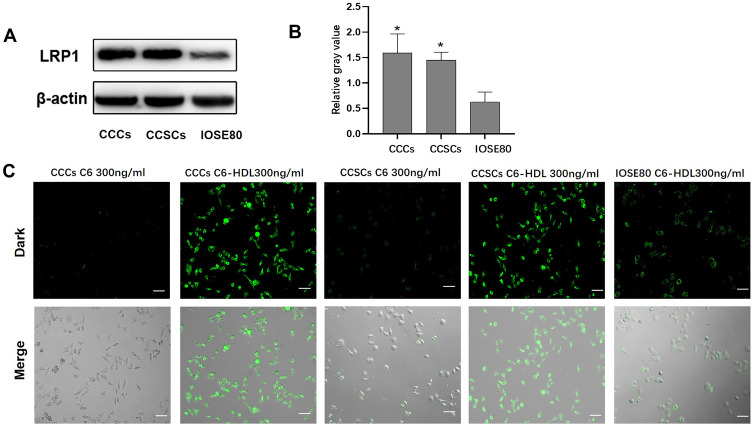
Figure 3.
Expression of LRP1 in CCCs and CCSCs and Cellular uptake of HDL Nanoparticles. (A) The expression of LRP1 in CCCs, CCSCs and IOSE80 cells assessed by Western blotting and (B) was the statistical value of the relative expression of the three times results in Figure 3A (n=3). *p < 0.05 compared with IOSE80. (C) Fluorescent images showing the cellular uptake of C6 and C6-HDL by CCCs, CCSCs and IOSE80 cells. Scale bar = 50μm.

