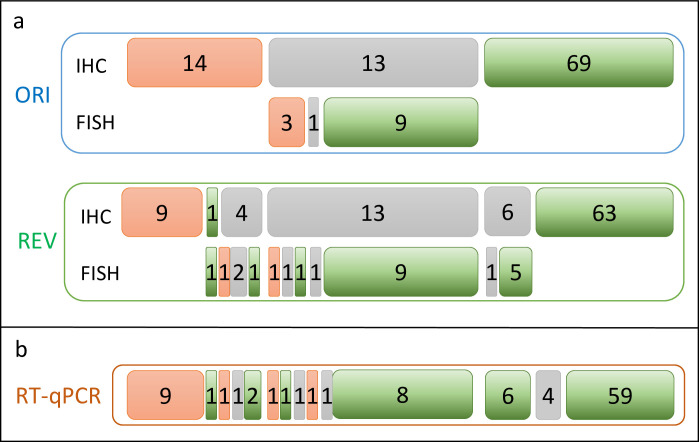
Fig 4. HER2 IHC/FISH discrepancies.
Schematic analysis of discrepancies in HER2: a. between the original assessment (ORI) and re-evaluation (REV) and b. between IHC (ORI) and RT-qPCR. Positive calls are indicated by red filled boxes. Negatives calls are presented in green and equivocal calls in grey, according to the 2013 ASCO/CAP guidelines in force at the time of the study.

