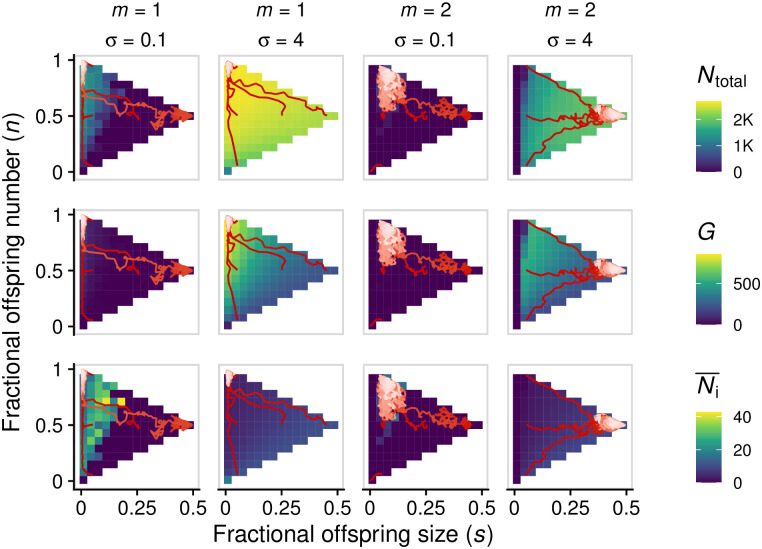
Fig 6. Evolution of fragmentation mode maximizes total number of cells (Ntotal, top row) rather than other quantities such as number of groups (G, middle row) or average group size (, bottom row).
Red lines represent evolutionary trajectories of the average mode of fragmentation over time (darker shades of red correspond to earlier time points). For each value of σ, we assessed five initial phenotypes. Parameters: all parameters are set to the default values, unless otherwise indicated (Table A in S1 Text), except: Kcells = 100, B0 = 0.01, Ktotal = 30, 000 (when σ = 0) or Ktotal = 10, 000 (otherwise), μs = μn = 10−2.

