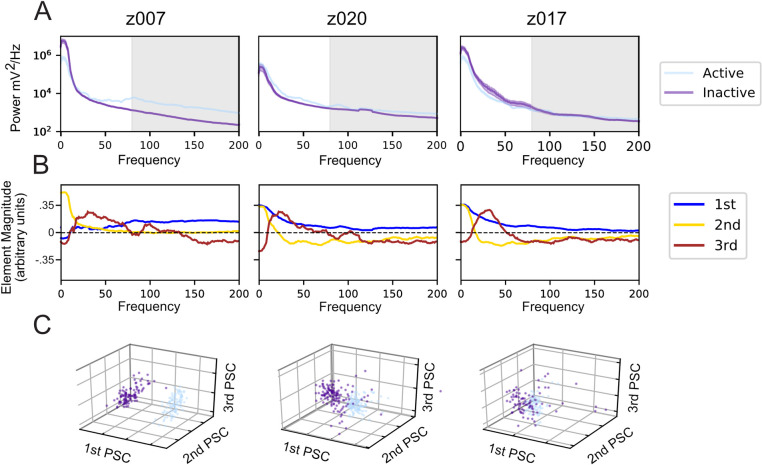
Fig 5. Naïve decomposition of LFP power spectra reveals song correlated features.
Representative results from a single electrode channel for each of the three subjects during its highest yield day. (A) Averaged power spectra during trials centered in 1-second intervals where the bird either initiates a motif, called vocally active (light blue), or does not vocalize, called vocally inactive (purple). The 80–200 Hz, or ‘High Gamma’ band, is shaded in grey. (B) The power spectra in Fig 4A are normalized and naively decomposed into PSCs (see Methods). The elements of the first principal spectral component (1st PSC, blue) are non-zero across all frequencies, likely due to the power law in LFP PSDs. The 2nd PSC, golden-yellow, peaks between 0 and 10 Hz. The 3rd PSC, burgundy, peaks between 10 and 30 Hz, but has variations across birds that extend into 50Hz. As the PSCs are all eigenvectors, their signs do not matter when interpreting them. This structure is largely consistent across channels and across days. (C) Projection of both the vocally active and vocally inactive trials onto the first three PSCs for the same channels in (A) and (B). The color coding is the same as (A). These projections include 84 trials per condition for z017, 100 trials per condition for z007, and 133 trials per condition for z020.

