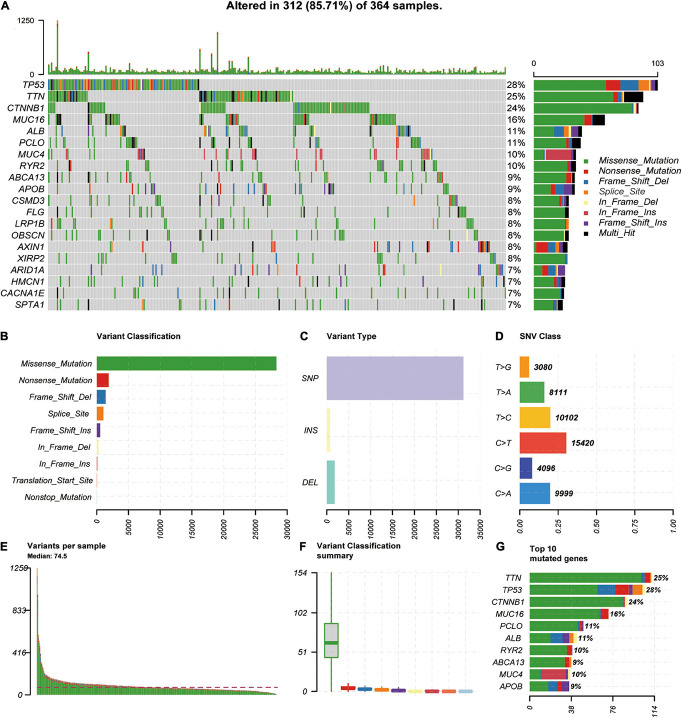
FIGURE 1.
Genome–wide mutation profiles in LIHC. (A) Landscape of mutation profiles in LIHC samples. Mutation information of each gene is shown in the waterfall plot, where different colors represent different types of variation. (B–D) Cohort summary plot displays distribution of variants according to variant classification, type, and SNV class. (E) Mutation load in each sample. (F) Variant classification in each sample. (G) Top 10 mutated genes in LIHC. LIHC, liver hepatocellular carcinoma; SNV, single-nucleotide variant.

