
FIGURE 5.
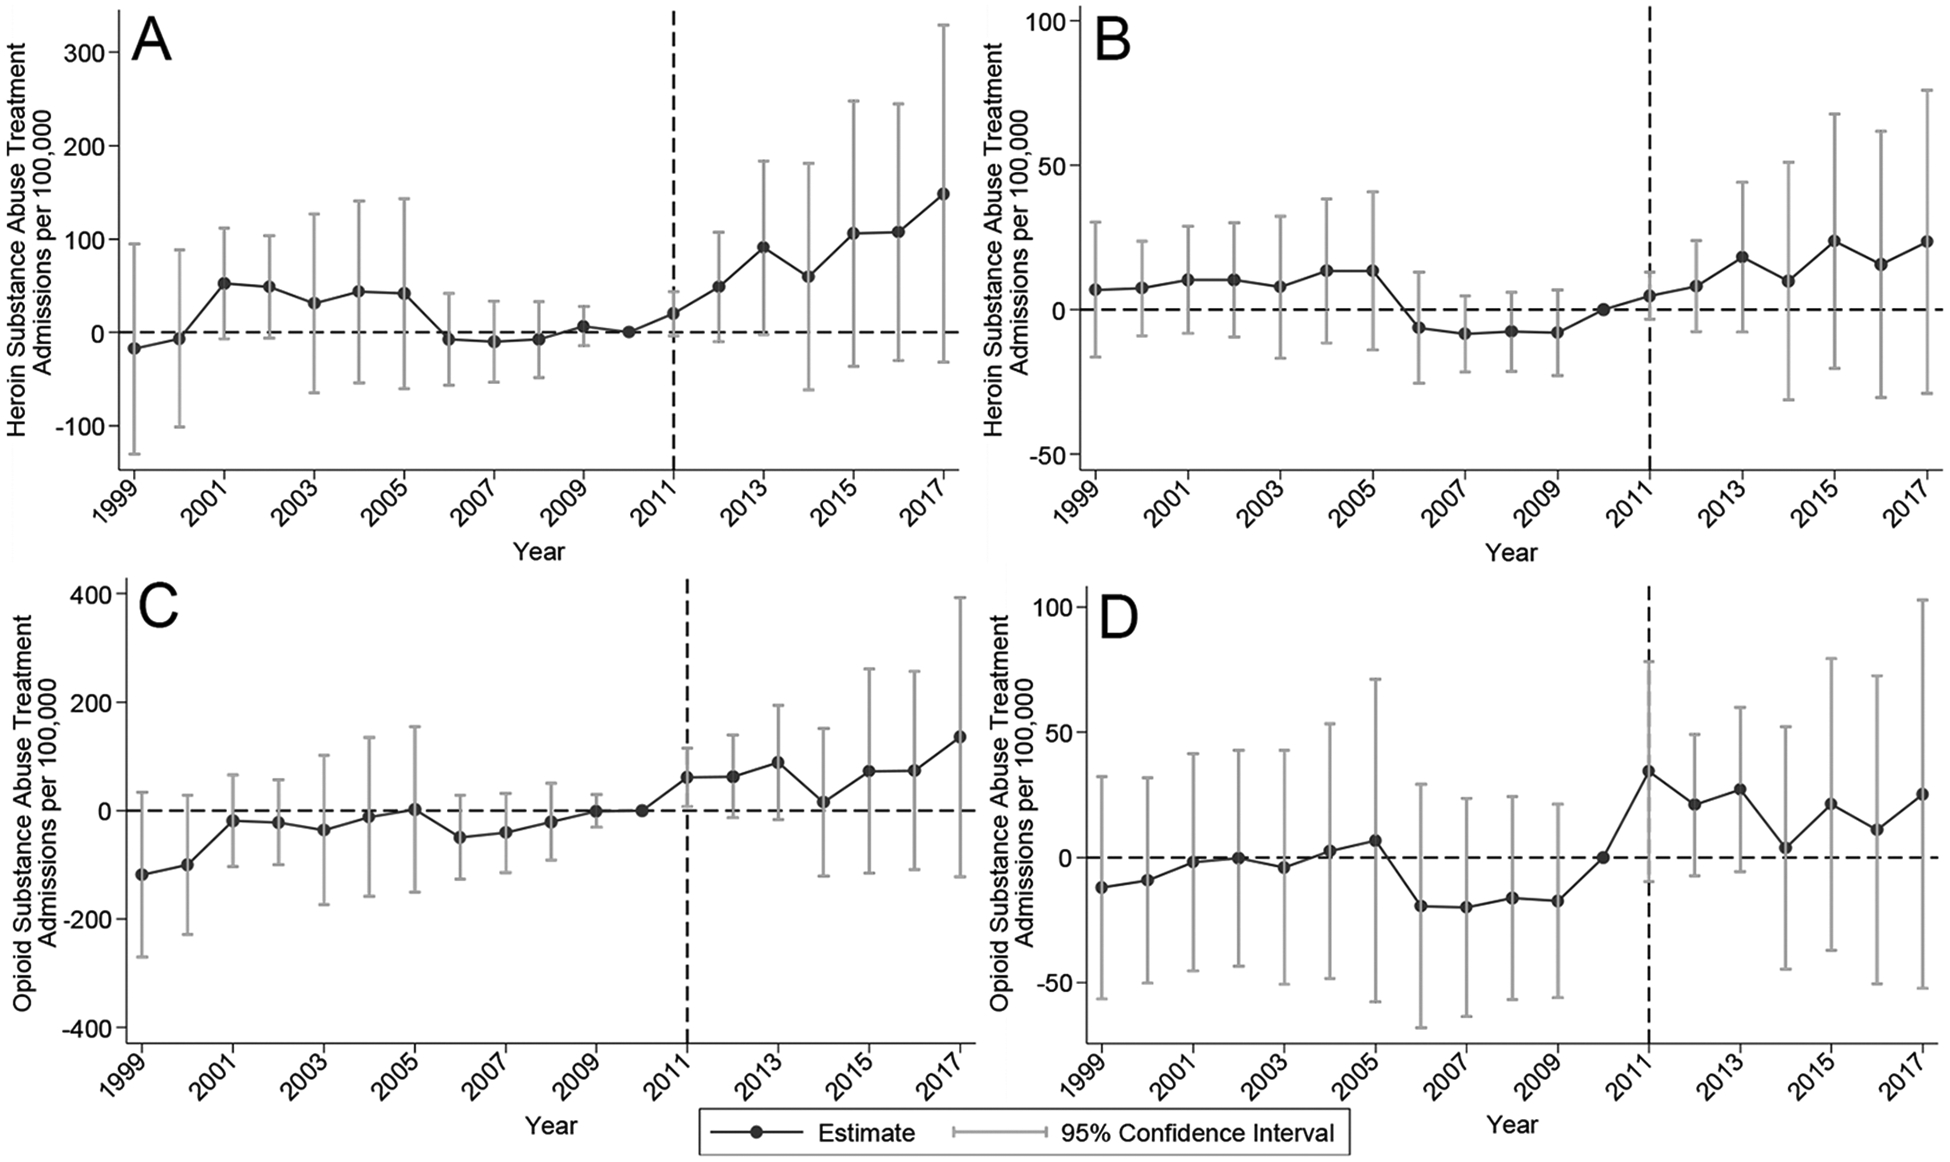
Nonmedical OxyContin misuse event study estimates for substance abuse treatment admissions. N =949. Ninety-five percent confidence intervals adjusted for state-level clustering. Outcome is substance abuse treatment admissions per 100,000 for the specified category for ages 12+. Data are from the TEDS. The estimates reported in the figures are the coefficients on the pre-reformulation nonmedical OxyContin use rate interacted with year indicators. The 2010 interaction is excluded and the corresponding estimate is normalized to zero. The specification includes state and time fixed effects. We also jointly estimate effects for pain reliever misuse interacted with year indicators. See main text for joint significance tests of post-reformulation estimates. A: All heroin. B: Heroin, no prior treatment admissions. C: All opioid. D: Opioid, no prior treatment admissions.