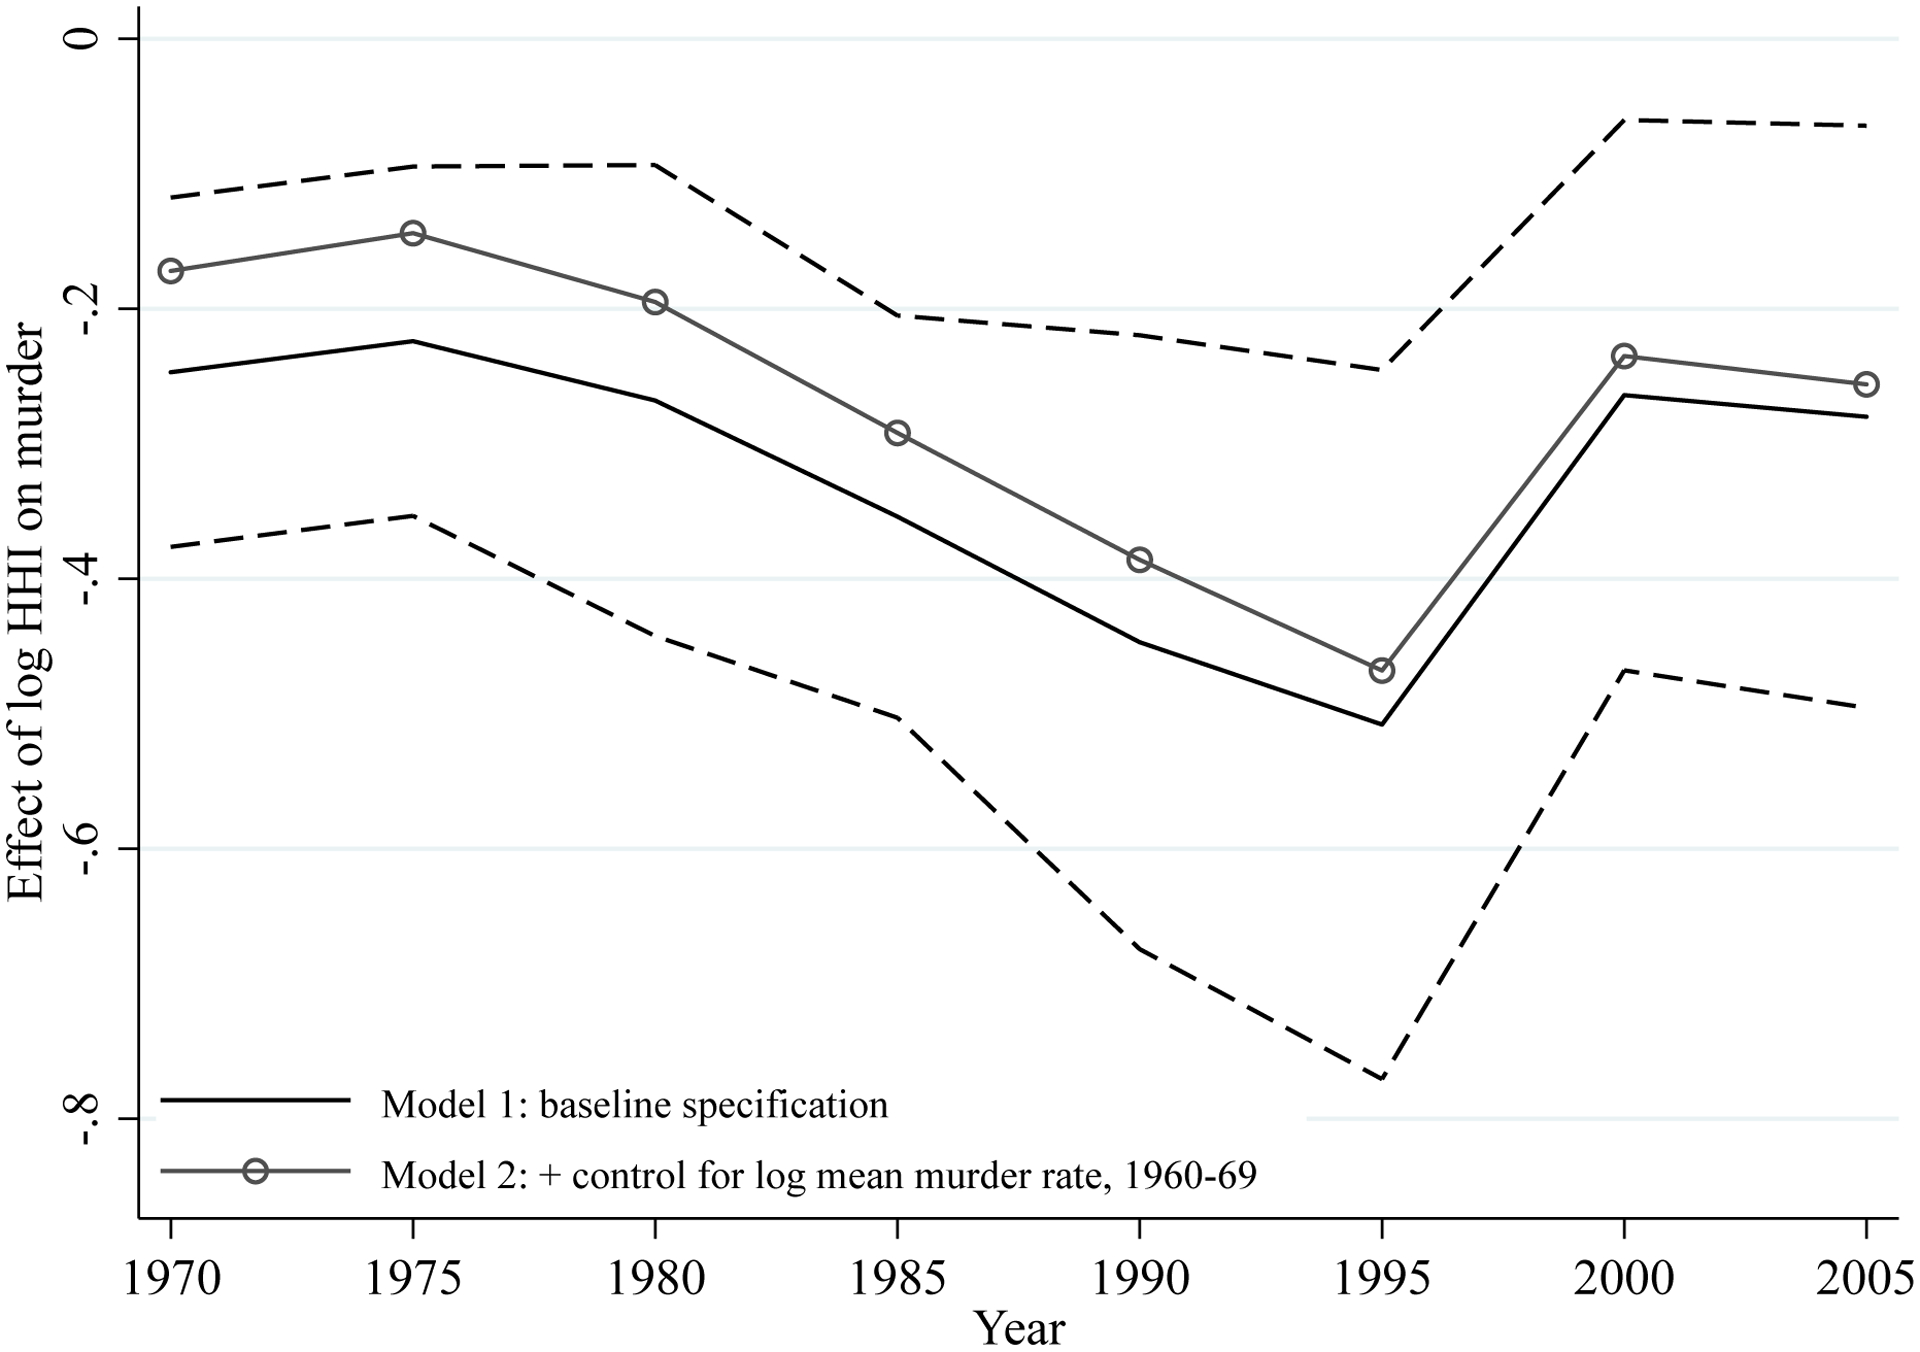
Figure 2:

The Effect of Social Connectedness on Murder, Assessing Threats to Empirical Strategy by Controlling for 1960–1969 Murder Rate
Notes: Figure shows point estimates and 95-percent confidence intervals from estimating equation (1) separately for years 1970–74, 1975–79, and so on. Model 1 includes the same covariates used in Table 2, and model 2 additionally controls for the log mean murder rate from 1960–69. Sources: See Table 2.
