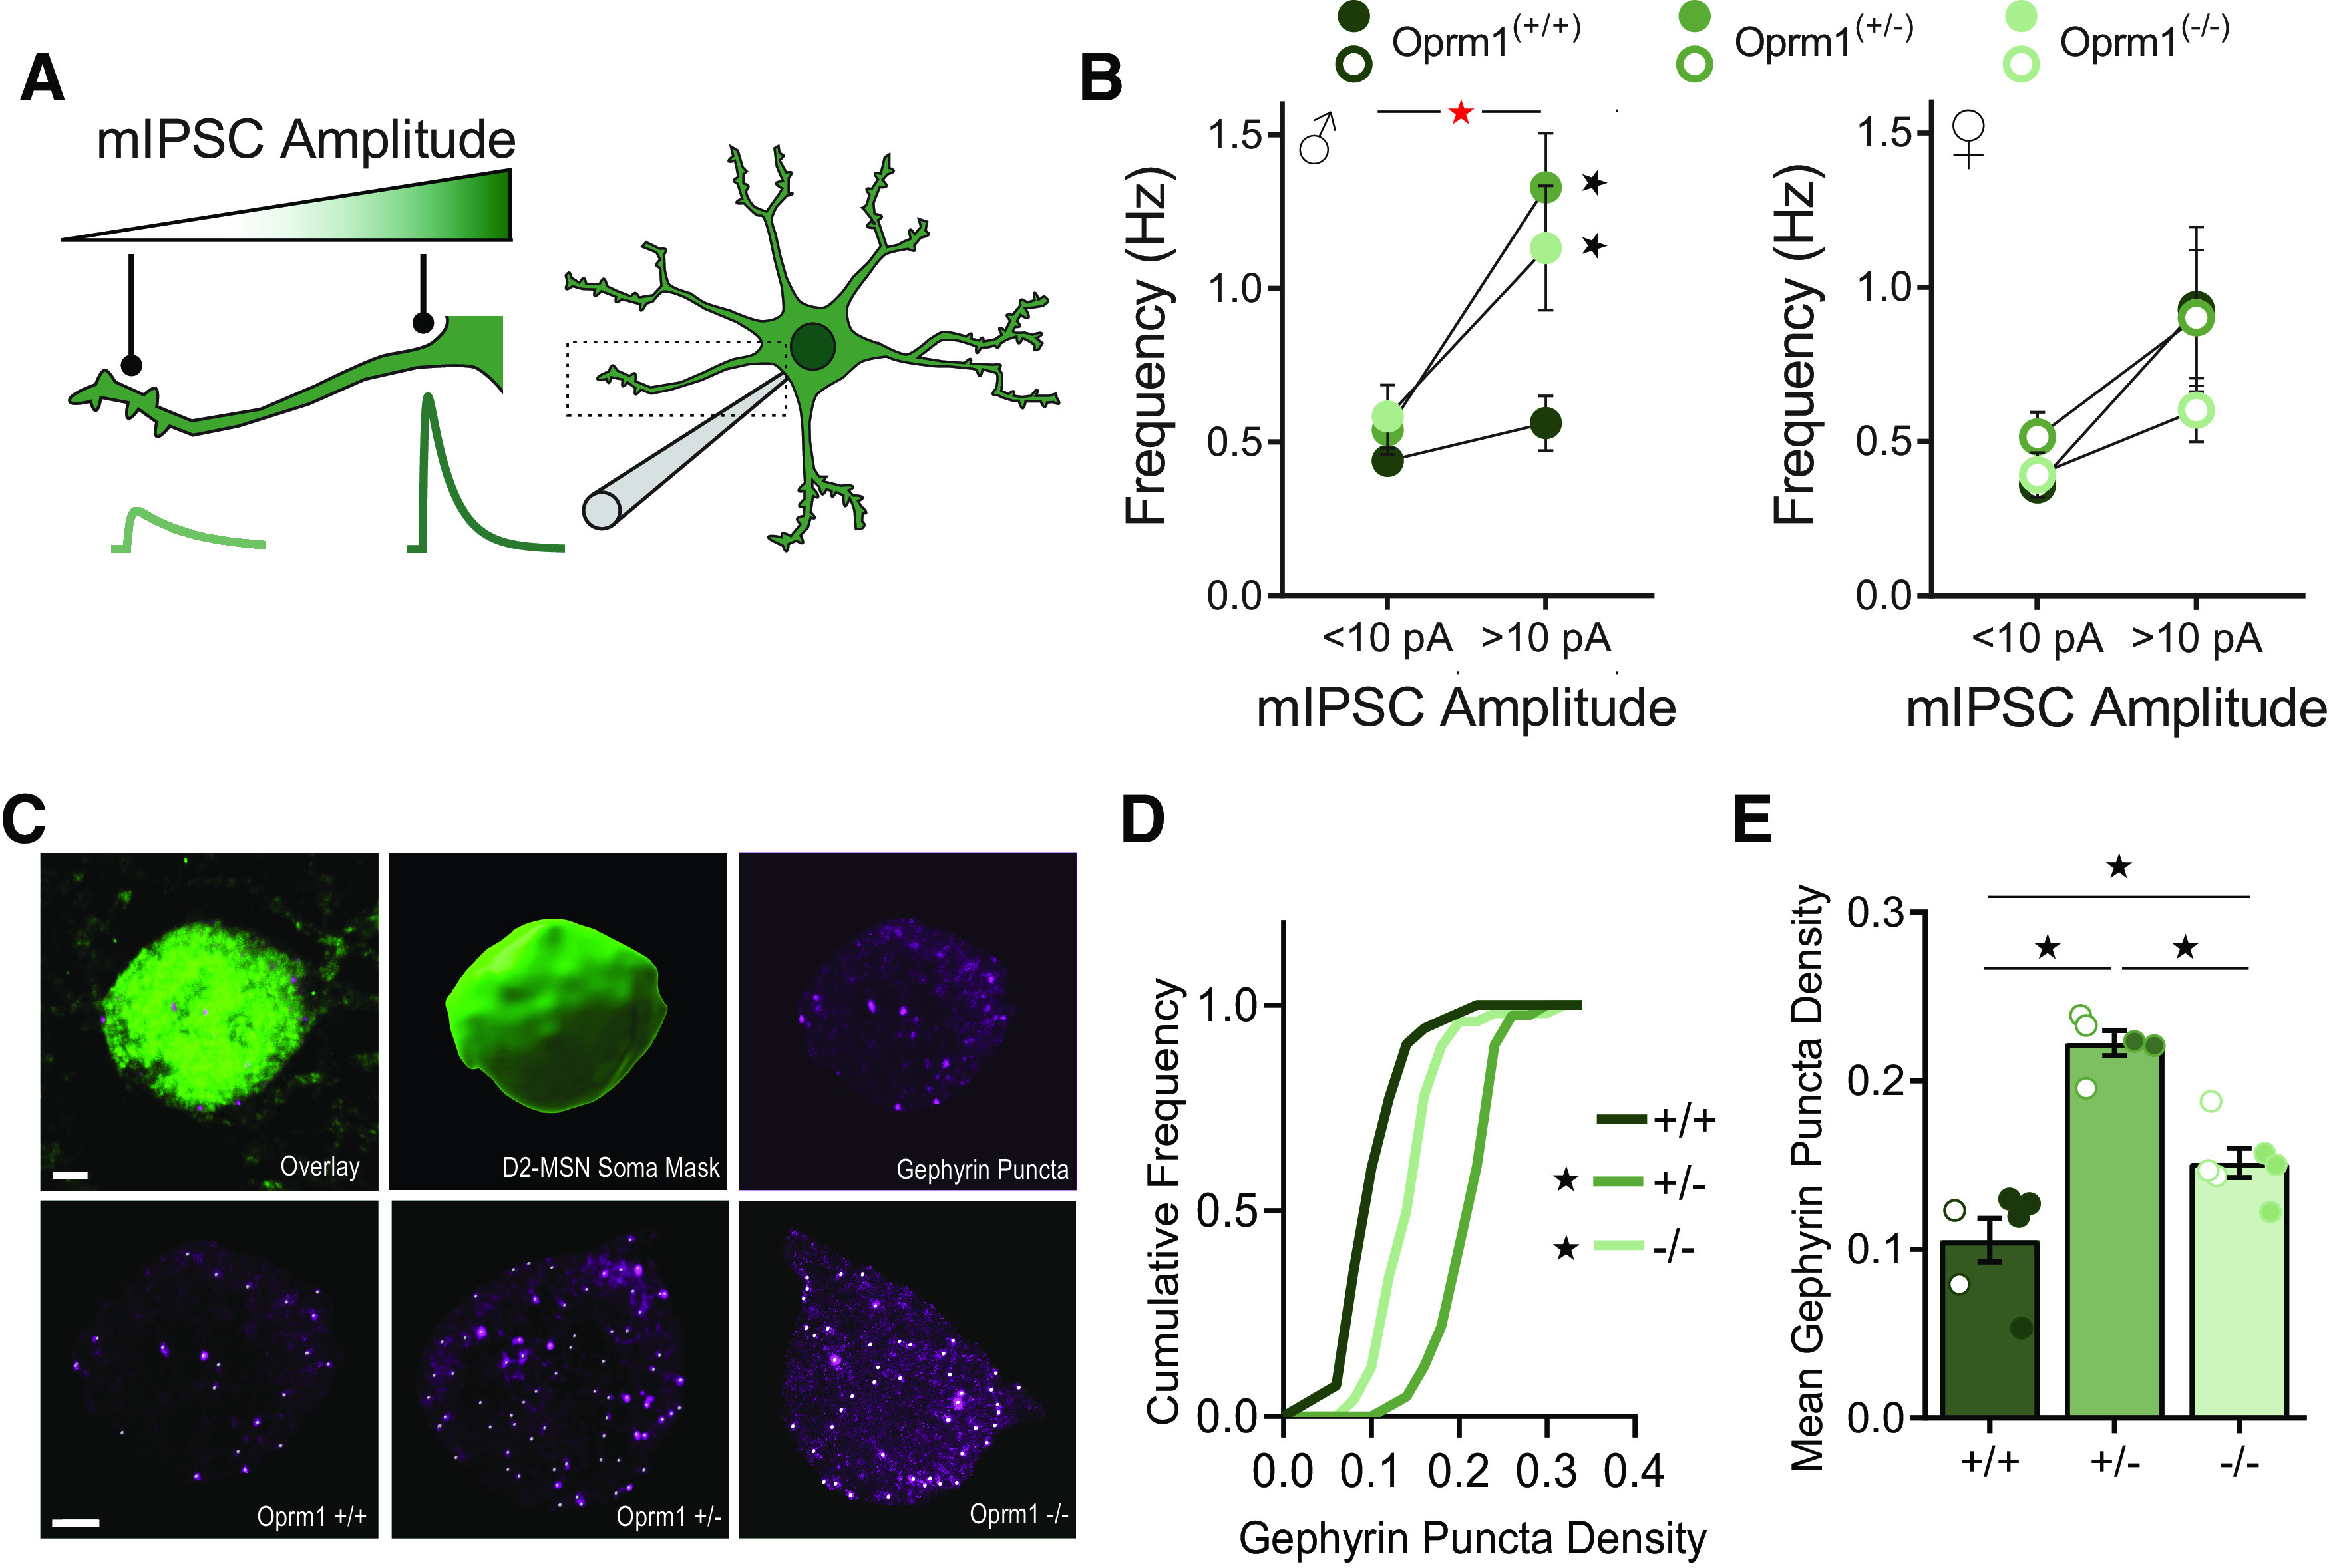
Figure 4.

Functional and structural analysis of perisomatic inhibitory synapses in D2-MSNs. A, Schematic diagram showing differences in mIPSC amplitude according to the location of the inhibitory synapses relative to the somatic recording electrode. B, Reanalysis of mIPSC frequency in D2-MSNs from Figure 3, separating event by sex and amplitude: small (<10 pA) or large (>10 pA). C, Examples of confocal images showing D2-eGFP fluorescence (top left) used to create a somatic mask (top middle) for analysis of perisomatic gephyrin-immunoreactive puncta (top right). The bottom row shows representative images for each genotype, with white dots highlighting gephyrin puncta. Scale bars, 2 μm. D, Cumulative probability plot of gephyrin puncta density for D2-MSNs from Oprm1+/+ (n = 250 cells), Oprm1+/− (n = 189 cells), and Oprm1−/− (n = 223 cells). E, Mean gephyrin puncta density for D2-MSNs from Oprm1+/+ (n = 6 mice), Oprm1+/− (n = 5 mice), and Oprm1−/− (n = 6 mice). All groups contained similar numbers of female mice (open symbols) and male mice (closed symbols). Red asterisk indicates a significant genotype × amplitude interaction (B). *p < 0.05 comparing Oprm1 mutant to control with LSD post hoc test (B) or Kolmogorov–Smirnov test (D), or LSD post hoc test between groups (E).
