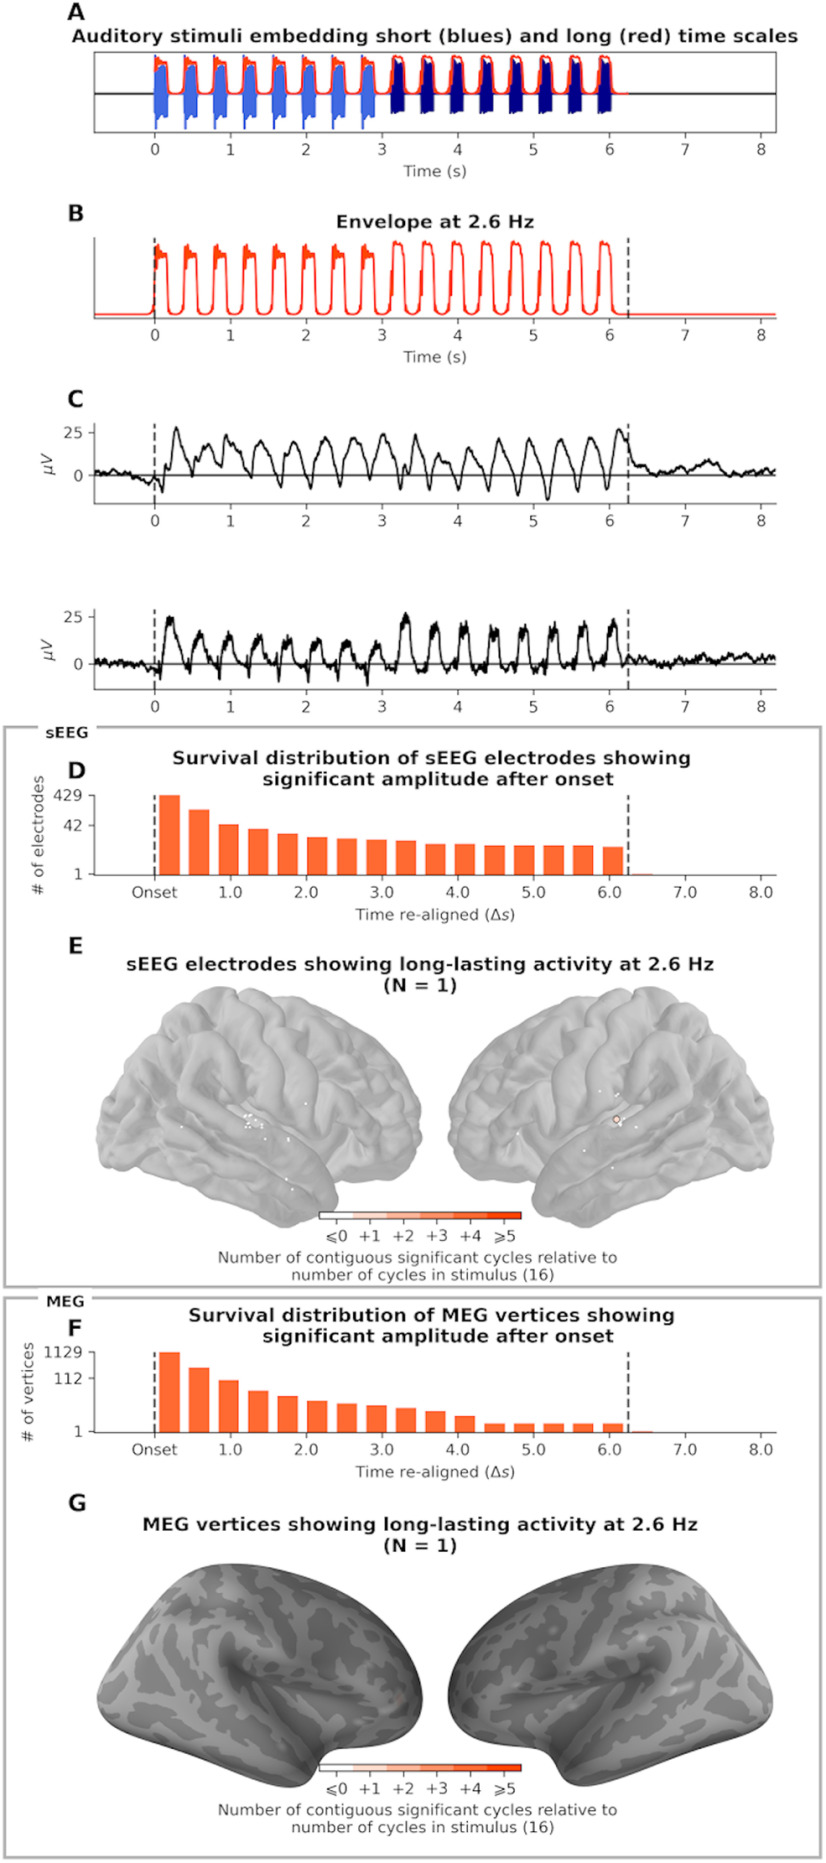
Figure 3.
Estimation of EFR duration (2.5 Hz). A, Auditory stimulus. B, Waveform of the envelope fluctuation at 2.5 Hz. C, Evoked unfiltered response of two example sEEG channels, from different participants, both in Heschl's gyrus. D, Survival distribution of sEEG channels with consecutive significant activity after onset. Channels whose activity lasts >16 cycles outlast the duration of the stimulus (N = 1 channel). E, Localization of sEEG channels having an EFR. The channel with long-lasting activity is circled. Color intensity indicates the number of cycles of post-stimulus activity (1). F, Survival distribution of MEG vertices activity showing consecutive significant activity after onset. G, Localization of MEG vertices that have an EFR. Color intensity indicates the number of cycles of post-stimulus activity (no vertex shows persistent activity except one with one cycle).

