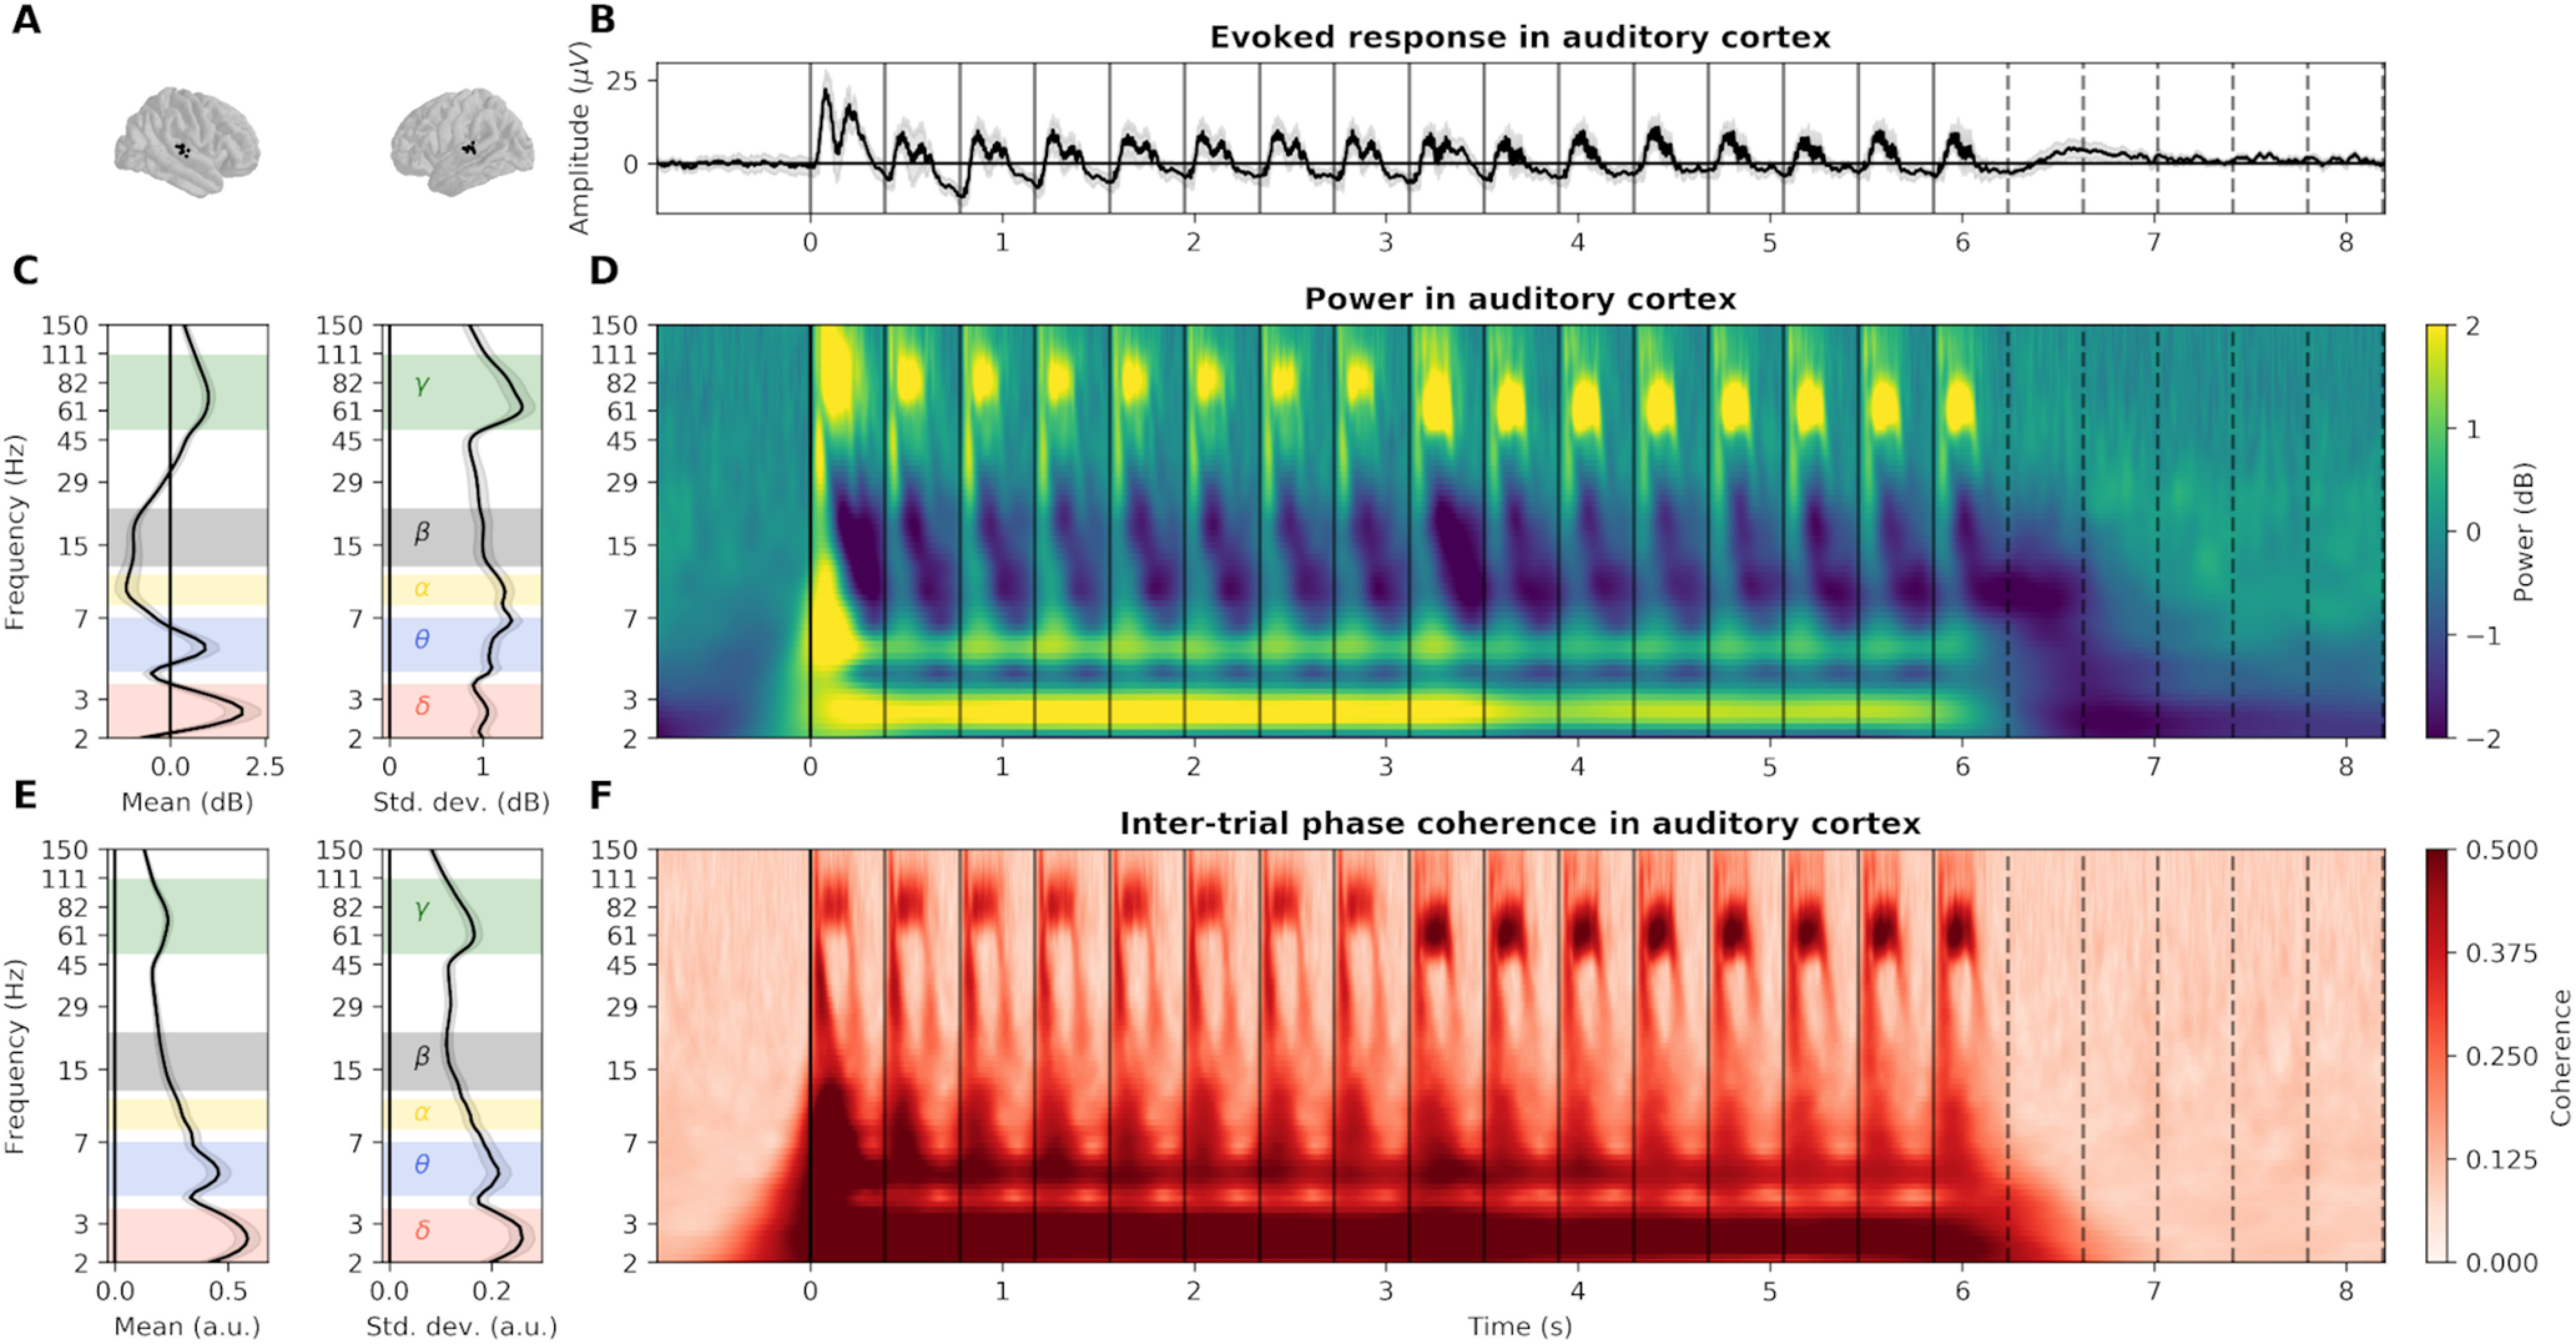
Figure 4.

Detailed EFR in auditory cortex recorded with sEEG. A, Localization of the sEEG channels located in bilateral auditory cortices. B, Evoked response, averaged across channels. Gray shaded area represents the SEM across sources. Vertical plain and dotted lines, respectively, indicate the onset of each tone and their theoretical continuation in the silence. C, Left, Average and (right) SD of power over time during stimulus presentation (0-6.2 s). Selected frequency bands are indicated by colored shaded areas (δ: 2-3.5 Hz; θ: 4-7 Hz; α: 8-11 Hz; β: 12-22 Hz; γ: 50-110 Hz). D, Power, averaged across channels, in dB relative to baseline. E, Left, Average and (right) SD of ITPC over time during the presentation of the stimulus. F, ITPC, averaged across channels. Note the presence of the FFR first at 80 Hz and then at 60 Hz both in power and ITPC, reflecting the change of tone fundamental frequency at ∼3 s.
