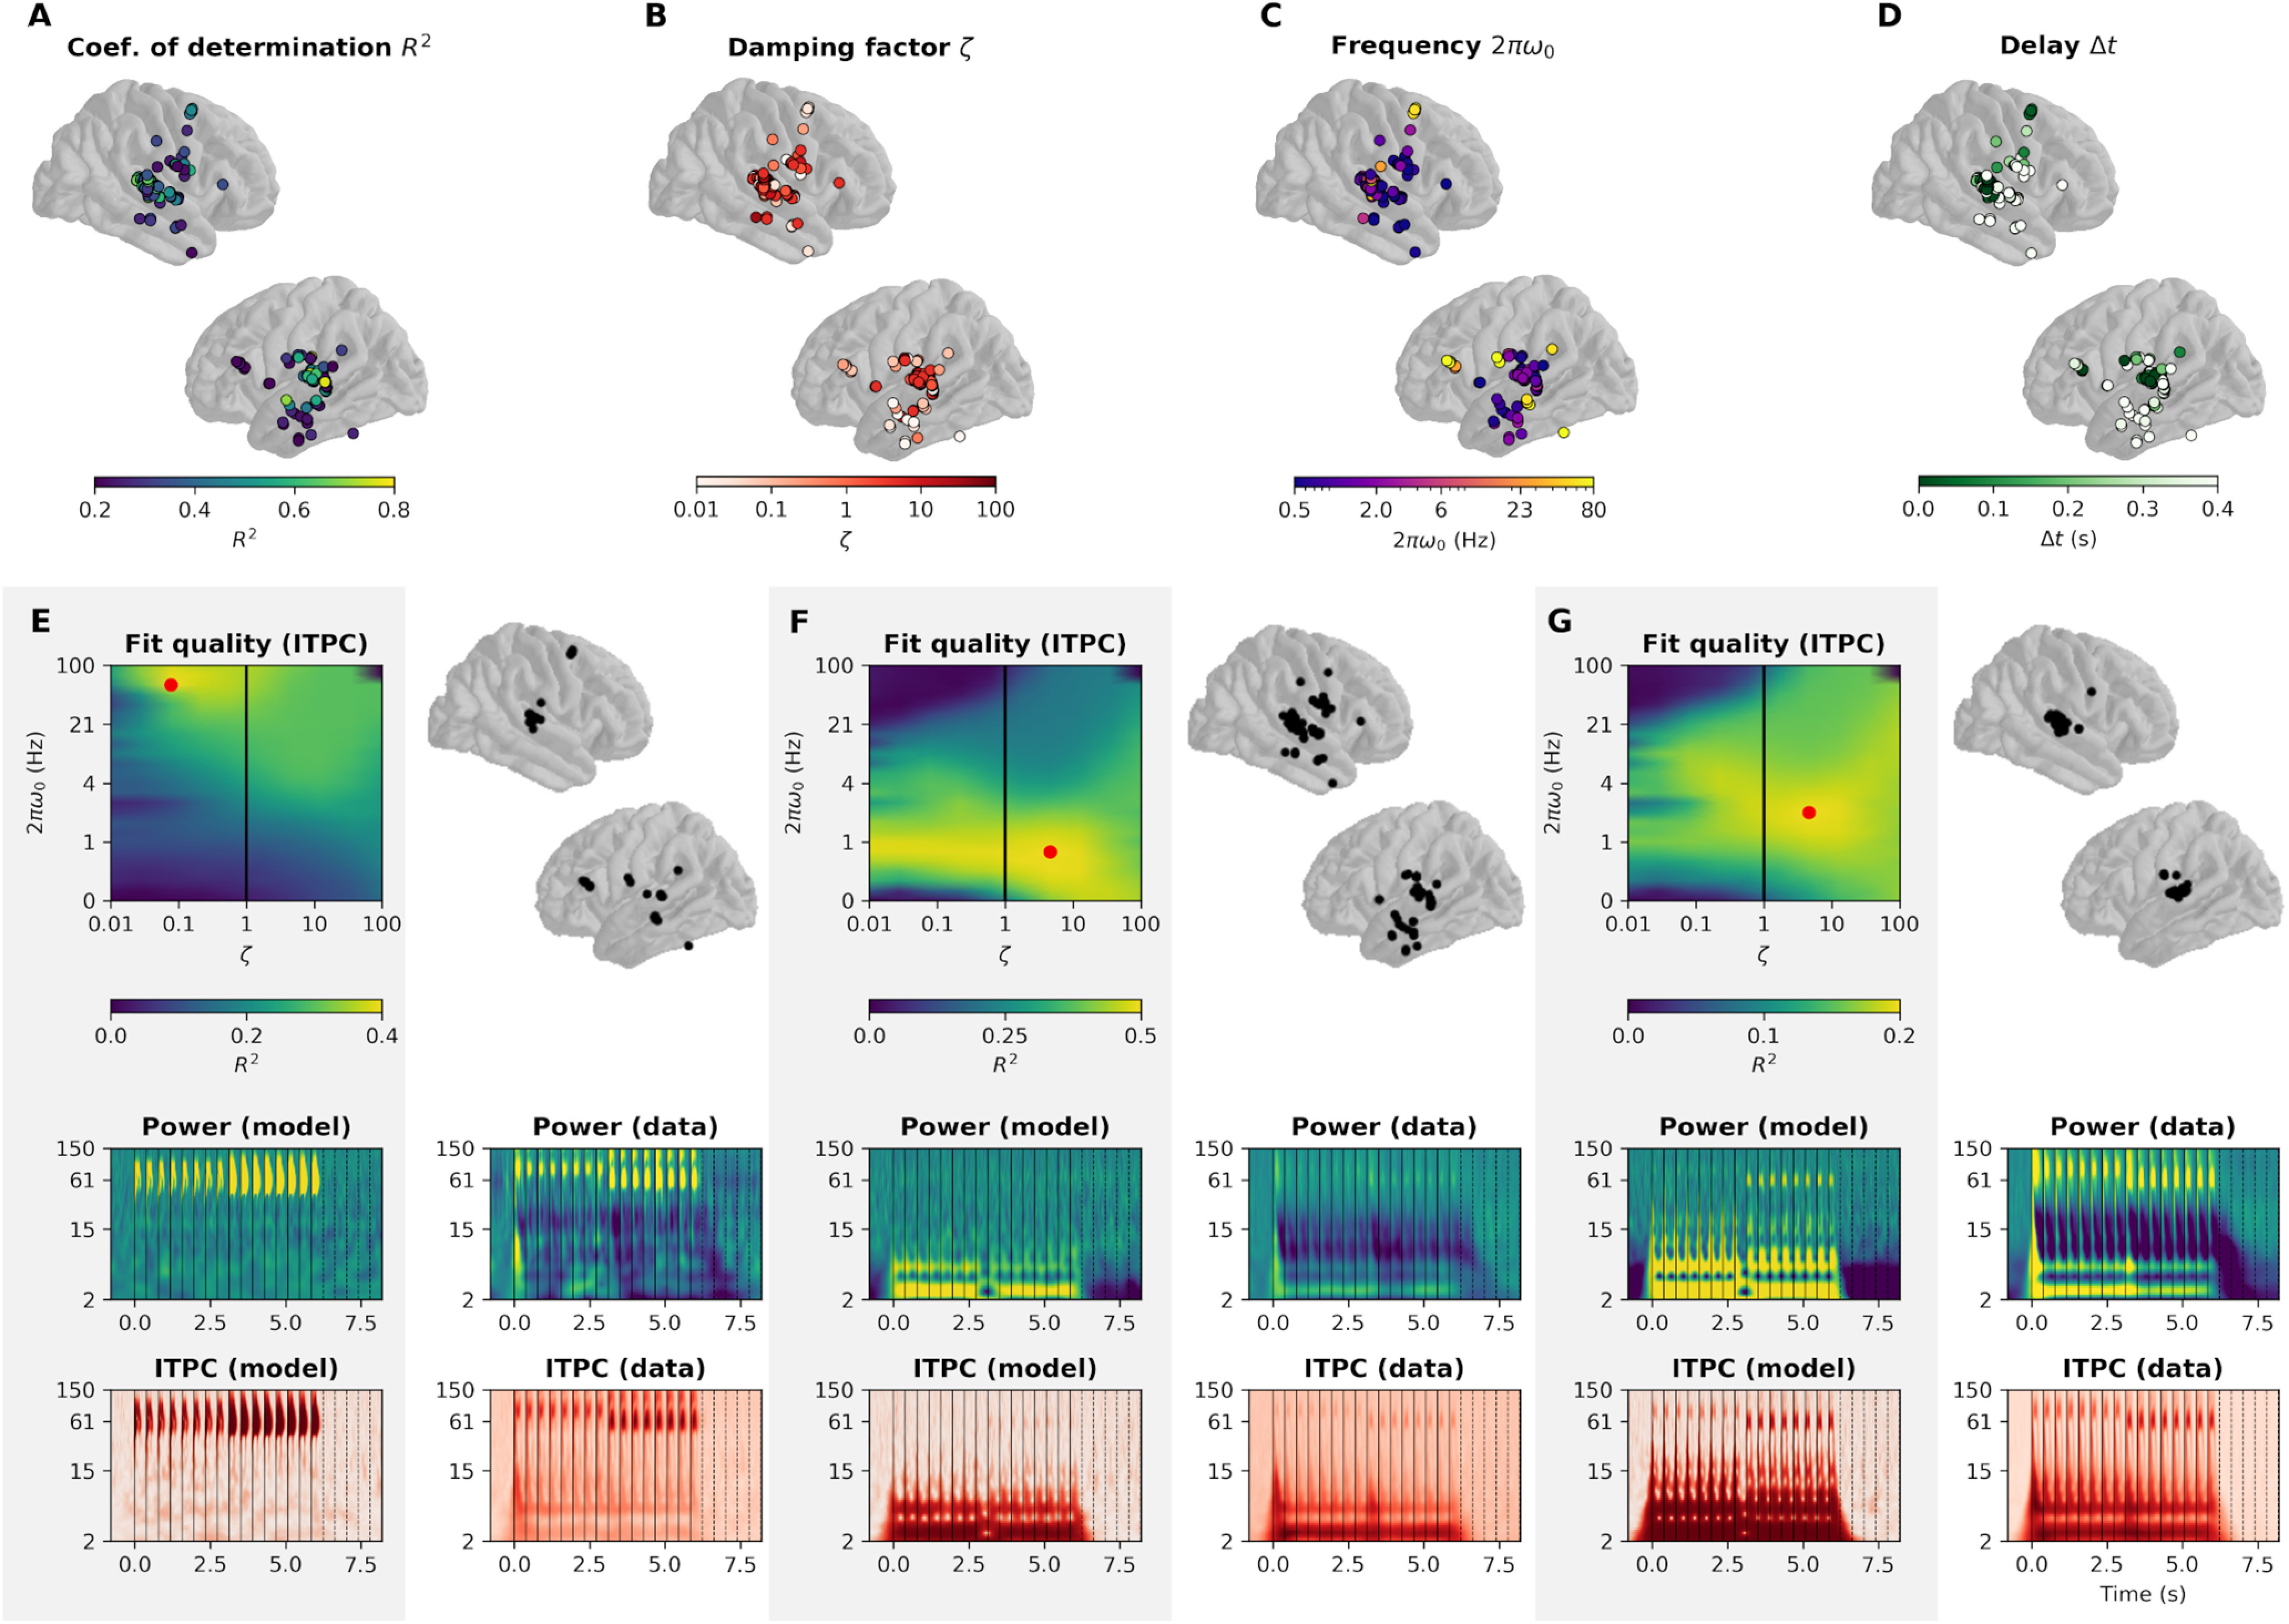
Figure 8.

Clustering of electrodes based on best fitting parameters. A, Coefficient of determination of the linear regression between ITPC of the best fitting model and ITPC of the data. B, Damping ratio ζ of the best fitting model. C, Eigenfrequency 2πω0 of the best fitting model. D, Time delay Δt of the best fitting model. E, Cluster 1. Left, Average fit quality (R2) as a function of model parameters. The best fitting model is highlighted in red. Right, Topography of the sEEG channels included in the cluster. Bottom left, Power and ITPC of the best fitting model for this cluster. Bottom right, Average power and ITPC of the sEEG channels included in the cluster. F, Cluster 2. G, Cluster 3. Only channels with R2 > 5% are shown.
