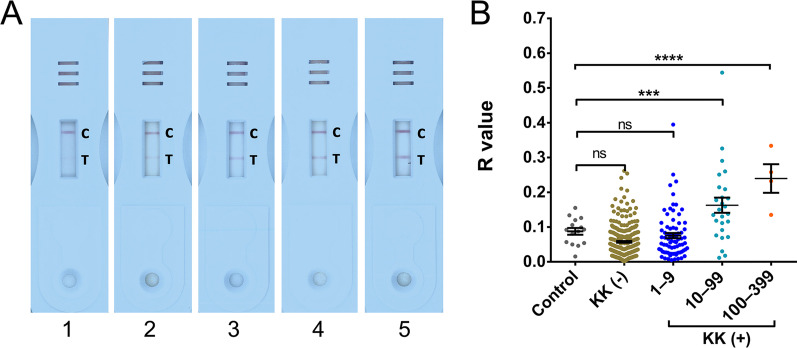
Fig. 2.
POC-CCA urine cassettes showing different R values and a scatter plot showing the distribution of R values in the different groups stratified by egg burdens and in the control group. A POC-CCA urine cassettes showing different levels of the R values. Lanes 1–5, cassettes showing an R value between 0–0.1, 0.1–0.2, 0.2–0.3, 0.3–0.4 and 0.5–0.6, respectively; B R values of the POC-CCA tests in controls, KK-negatives and KK-positives with different egg burdens (Control, n = 15; KK (−), n = 304; EPG 1–9, n = 78; EPG 10–99, n = 26; EPG 100–399, n = 4). P values were calculated using One-way ANOVA (ns = no significant difference, *** = P < 0.001, **** = P < 0.0001). C Control line, T Test line, KK Kato-Katz, POC-CAA Point-of-care circulating cathodic antigen

