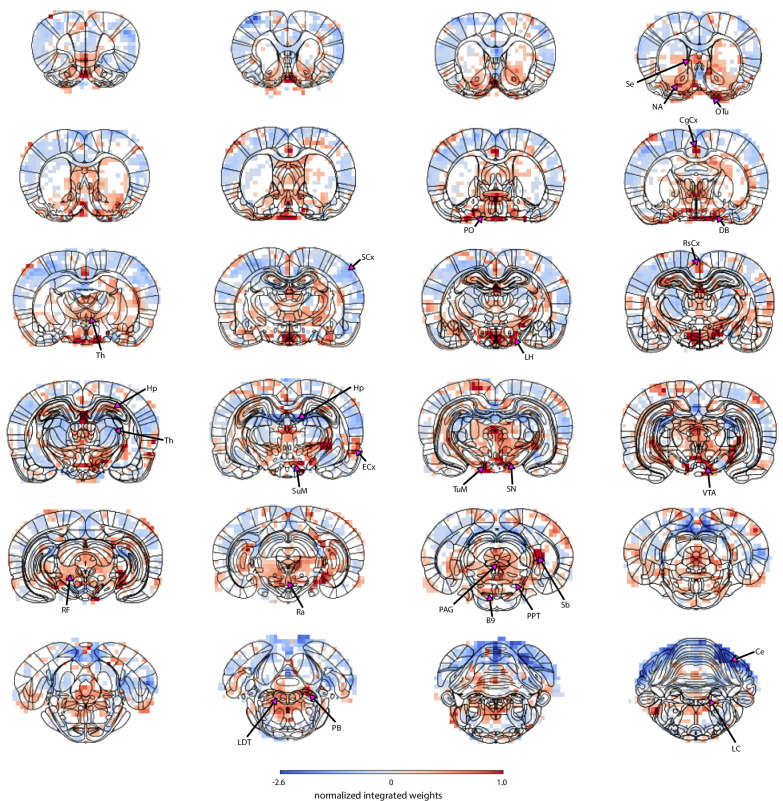
Figure 4. Localization of pupil dynamics-related information content across the brain.
The spatial map highlights regions from which pupil-related information was decoded. It was created by integrating PCA spatial maps with weights of the trained linear regression model. The map displays positive weights in all neuromodulatory regions of the ascending reticular activating system as well as in other regions involved in autonomous regulation – the lateral and preoptic hypothalamus and the periaqueductal gray. The subcortical basal forebrain nuclei (the horizontal limb of the diagonal band, nucleus accumbens, and olfactory tubercle) and the septal area were also positively coupled to pupil dynamics. Finally, regions of the hippocampal formation – the hippocampus, entorhinal cortex and subiculum, as well as cingulate, retrosplenial and visual cortices showed positive weights. The thalamus and the hippocampus had both positive and negative weights. Strong negative weighting was found in the cerebellum and most somatosensory cortical regions. Masked regions (white) did not pass the false discovery rate corrected significance threshold (p=0.01). Abbreviations: B9 – B9 serotonergic cells, Ce – cerebellum, CgCx – cingulate cortex, DB – horizontal limb of the diagonal band, ECx – entorhinal cortex, Hp – hippocampus, LC – locus coeruleus, LDT – laterodorsal tegmental nuclei, LH – lateral hypothalamus, NA – nucleus accumbens, OTu – olfactory tubercle, PAG – periaqueductal gray, PB – parabrachial nuclei, PO – preoptic nuclei, PPT – pedunculopontine tegmental nuclei, Ra – raphe, RF – reticular formation, RsCx – retrosplenial cortex, Sb – subiculum, SCx – somatosensory cortex, Se – septal nuclei, SN – substantia nigra, SuM – supramammillary nucleus, Th – thalamus, TuM – tuberomammillary nucleus, VTA – ventral tegmental area.

