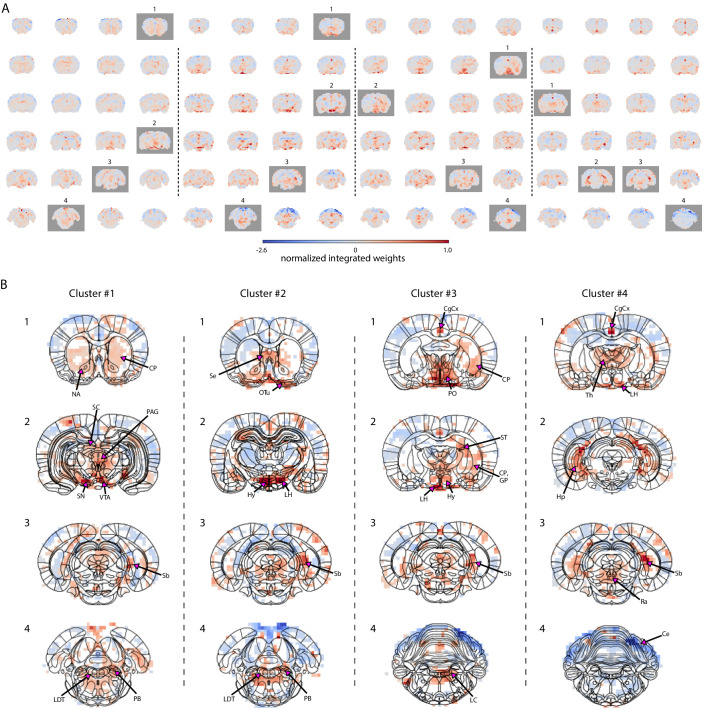
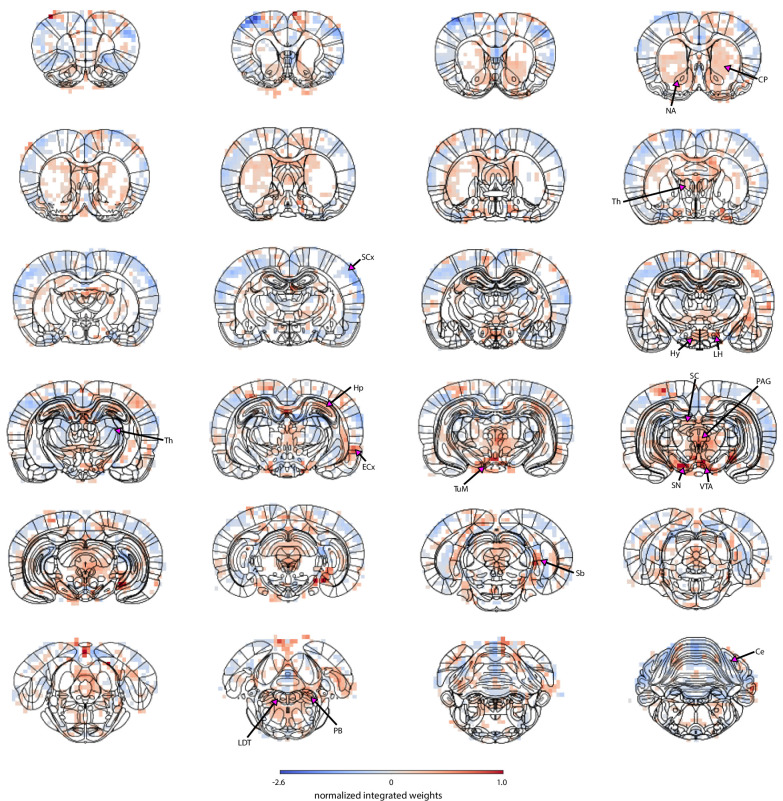
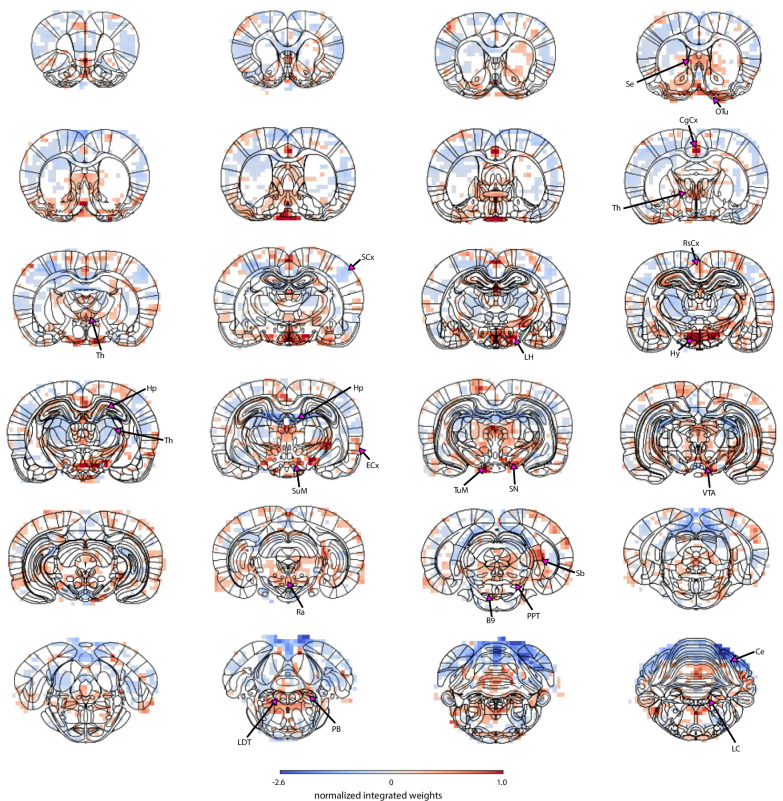
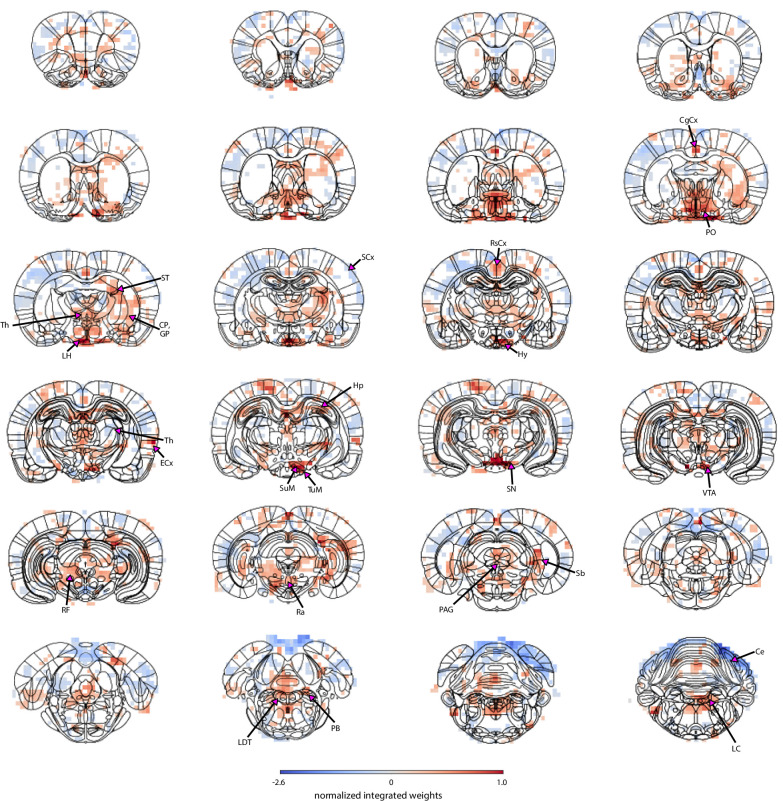
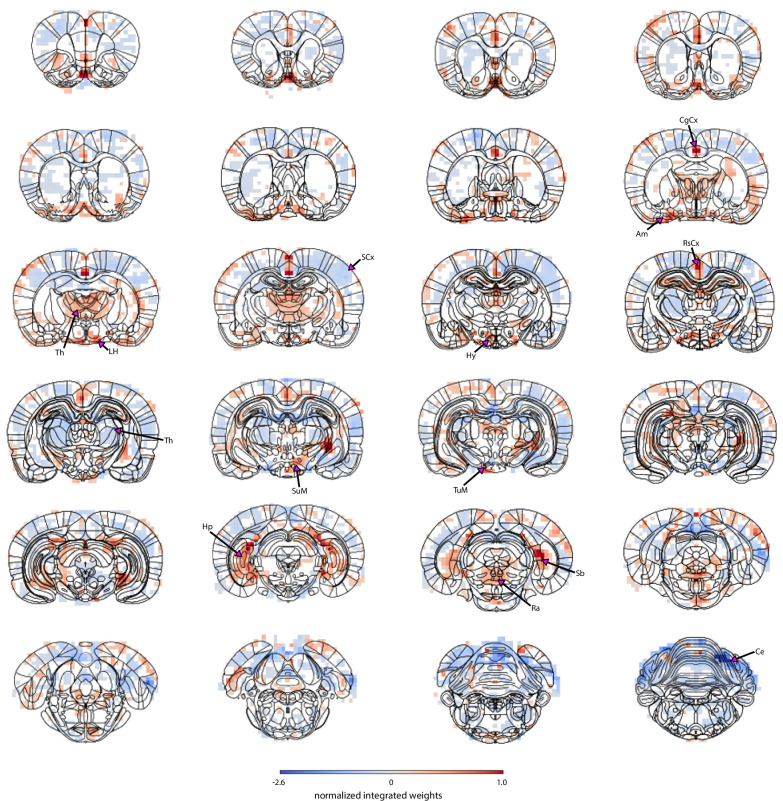
Figure 5. Characterization of brain state-specific pupil–fMRI relationships.
(A) Pupil information content maps generated by integrating PCA spatial maps with weights of linear regression models trained on cluster-specific trials. In all clusters, negative weights were found in the somatosensory cortex, the cerebellum, and posterior parts of the thalamus. All clusters had positive weights in anterior thalamic, preoptic and hypothalamic nuclei, subiculum, parts of the hippocampus and in the region containing the tuberomammillary nucleus. Clusters 1–3 displayed positive weights in neuromodulatory brainstem regions, substantia nigra, and ventral tegmental area, as well as the entorhinal cortex. The cingulate cortex and retrosplenial cortex and supramammillary nucleus were positive in clusters 2–4. Marked with gray are frames plotted in (B). (B) Cluster-specific spatial patterns are portrayed on slices selected from A (marked with gray rectangles). Characteristic to cluster 1 were positive weights in the dopaminergic substantia nigra and ventral tegmental area as well as in their efferent projections in the nucleus accumbens and caudate-putamen. Positive weighting was also found in the periaqueductal gray and brainstem laterodorsal tegmental and parabrachial nuclei, as well as in the superior colliculus. Cluster 2 was characterized by the strongest positive weights in hypothalamic regions, lateral in particular. Brainstem areas containing the arousal-regulating locus coeruleus, laterodorsal tegmental, and parabrachial nuclei, as well as the septal area and the olfactory tubercle displayed high positive weights. In cluster 3, as in cluster 2, the area containing the locus coeruleus, laterodorsal tegmental, and parabrachial nuclei showed positive linkage with pupil dynamics. The highest cluster 3 values were located in preoptic and other hypothalamic areas, as well as in stria terminalis carrying primarily afferent hypothalamic fibers, caudate-putamen, and globus pallidus. In cluster 4, the neuromodulatory region showing the strongest positive weights was the caudal raphe. The anterior parts of the brainstem displayed negative weighting. Characteristic to cluster 4 were high weights in the thalamus and in the hippocampus and the subiculum forming the hippocampal formation. Masked regions (white) did not pass the false discovery rate corrected significance threshold (p=0.01). Abbreviations: Ce – cerebellum, CgCx – cingulate cortex, CP – caudate-putamen, GP – globus pallidus, Hp – hippocampus, Hy – hypothalamus, LC – locus coeruleus, LDT – laterodorsal tegmental nuclei, LH – lateral hypothalamus, NA – nucleus accumbens, OTu – olfactory tubercle, PAG – periaqueductal gray, PB – parabrachial nuclei, PO – preoptic nuclei, Ra – raphe, Sb – subiculum, SC – superior colliculus, Se – septal area, SN – substantia nigra, ST – stria terminalis, Th – thalamus, VTA – ventral tegmental area.

