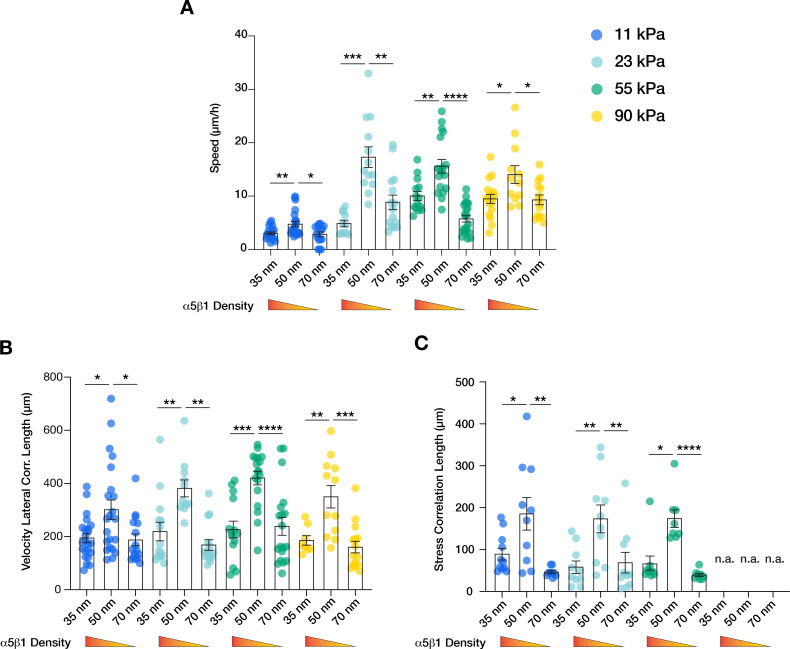
Figure 4. α5β1 ligand spacing outweighs substrate stiffness in collective cell migration.
Quantification of the migratory speed (A), velocity lateral correlation length (B), and stress correlation length (C) of keratinocyte sheets on different substrate rigidities (11 kPa – blue, 23 kPa – teal, 55 kPa – green, 90 kPa – yellow) and integrin α5β1 ligand lateral spacing (35, 50, 70 nm). Scatter plots show values and mean ± s.e.m. from at least three independent experiments. n.a. = not applicable; *p < 0.05; **p < 0.01; ***p < 0.001; ****p < 0.0001 using a Mann-Whitney test.

