Figure 2.

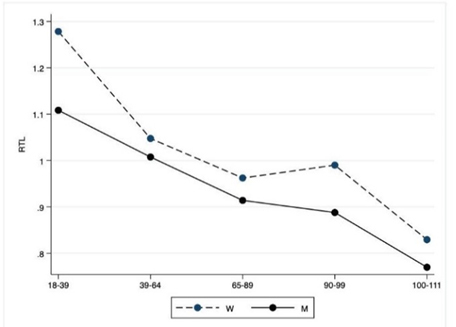
Molecular tests. The figure shows the trend of mean values by class of ages and gender related to RTL. Y-axis reports the mean values of the analysed biomarker, x-axis reported the age-class (for the acronyms see the Table 2).

Molecular tests. The figure shows the trend of mean values by class of ages and gender related to RTL. Y-axis reports the mean values of the analysed biomarker, x-axis reported the age-class (for the acronyms see the Table 2).