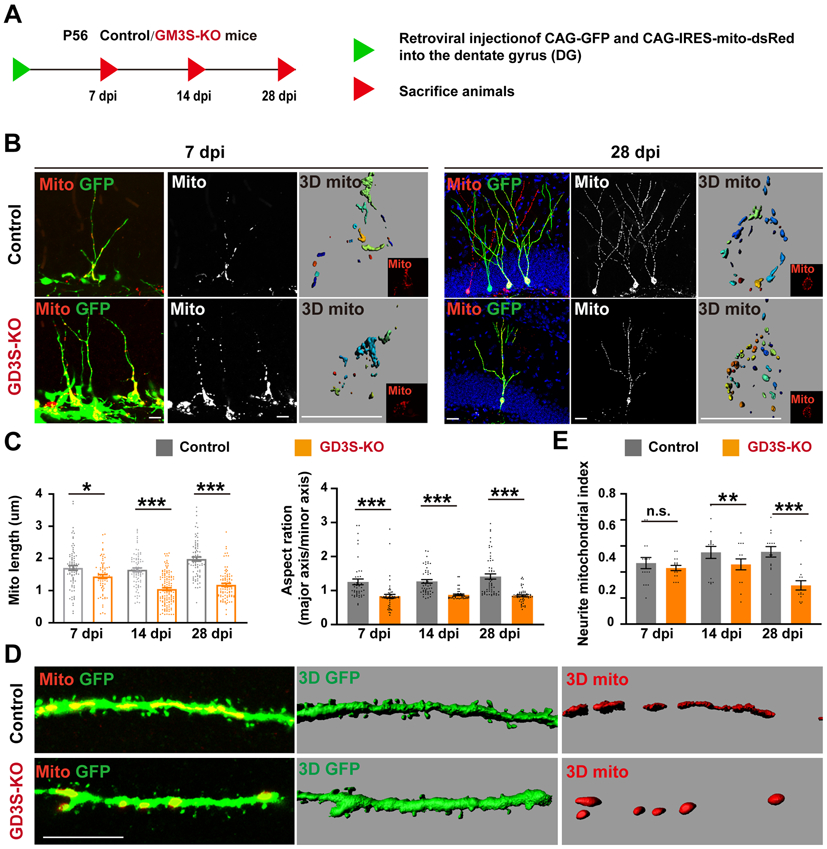
Figure 6. GD3 regulates mitochondrial dynamics in vivo.

(A) Experimental scheme of visualization of mitochondria and cell morphology in adult-born neurons. (B) Representative confocal and 3D pictures (last one) of mitochondria in nascent neurons in adult brain. (C) Quantification of mitochondrial length, aspect ratio and percentage of neurons with fragmented mitochondria in adult newborn neurons. n = 100 mitochondria from 4 mice / groups. (D) A segment of dendrites was enlarged. (E) Quantification of neurite-mitochondrial index (total mitochondrial length/neurite length), an index for mitochondrial density. n = 16 neurites from 4 mice / group.
Panel C on the right: y axis should be aspect ratio, not ration.
