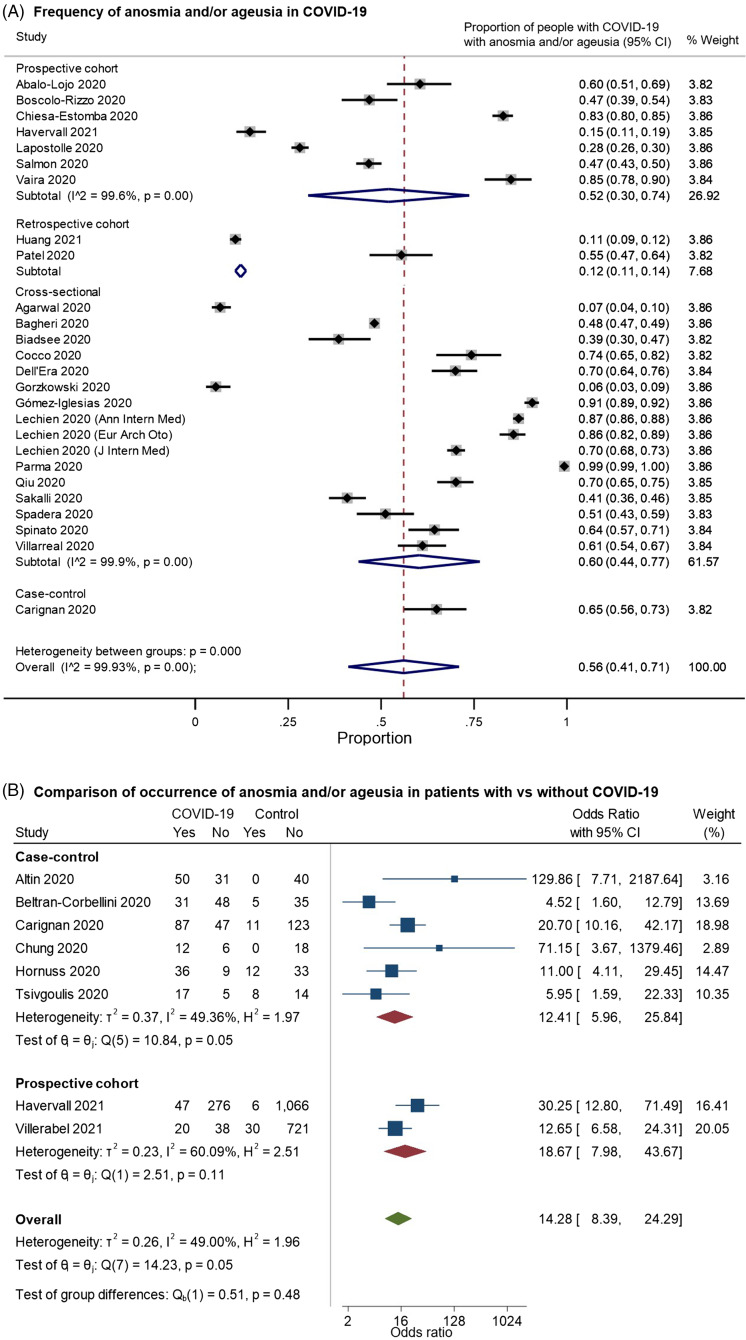
Figure 4.
Forest plots from random-effects meta-analyses for studies examining (A) the proportion of patients with COVID-19 who have anosmia and/or dysgeusia (restricted to studies with at least 100 patients) and (B) comparing the occurrence of these symptoms with control groups without COVID-19. The studies are grouped by their design (cross-sectional, case–control, retrospective or prospective cohorts). They included a heterogeneous mix of hospitalized and community-dwelling patients. In Figure 4B, the “Yes” columns indicate the number of patients in a given group (COVID-19 patients or control) who had anosmia and/or ageusia, while “No” indicates the number of patients who did not have this symptom.

