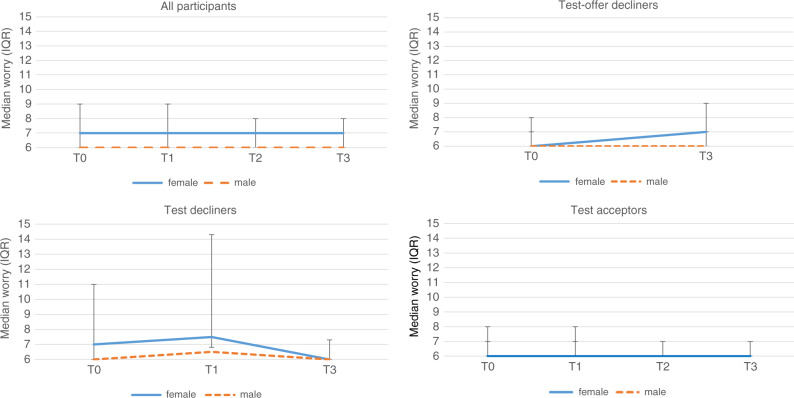
Fig. 3. Median worry scores (adapted 6-item Cancer Worry Scale (CWS) scores) by group over time.
Median levels of worry (adapted CWS scores) over time (T0, T1, T2, T3) for the total group (all participants), and the three subgroups: test offer decliners, test decliners, and test acceptors. For each group, the course of worry is distinguished between female (solid line, blue) and male (dashed line, orange) respondents. For the total group (all participants) and the test acceptors, note that the median worry scores for female and male respondents overlap. The error bars represent the limits of the interquartile range (1st and 3rd quartile). Summary data of the between-group differences at T0 and T3 can be found in Supplementary Tables S3 and S4. Summary data of the within-group differences between T3 and T0 can be found in Supplementary Table S5.

