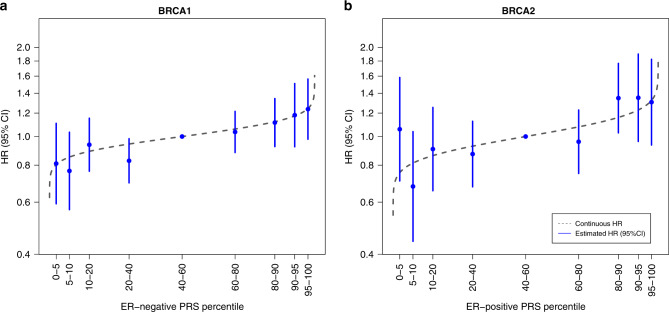
Fig. 2. Association between categories of the PRS and contralateral breast cancer risk for BRCA1 and BRCA2 heterozygotes.
HRs and 95% CI for percentiles of the ER-negative PRS313 for BRCA1 heterozygotes and the ER-positive PRS313 for BRCA2 heterozygotes, relative to the middle quintile. The PRS percentile groups were 0–5%, 5–10%, 10–20%, 20–40%, 40–60% (reference), 60–80%, 80–90%, 90–95%, and 95–100% based on the distribution in unilateral breast cancer cases. The numbers and corresponding effect sizes are shown in Table 2. The gray line represents the distribution based on the HR of the continuous ER-negative PRS313 and ER-positive PRS313 and the distribution in unilateral breast cancer cases of BRCA1 and BRCA2 heterozygotes respectively. CI confidence interval, ER estrogen receptor, HR hazard ratio, PRS polygenic risk score.

