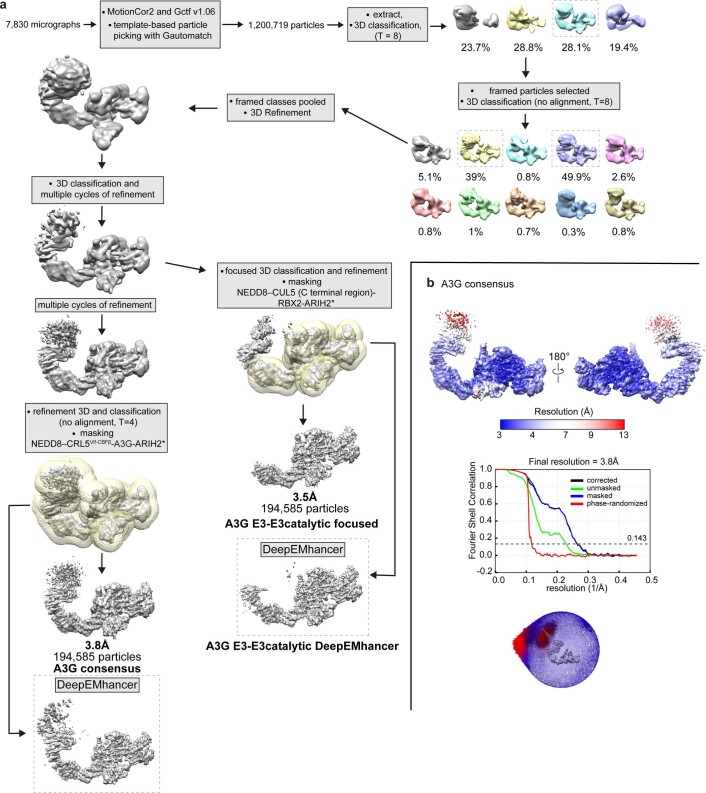
Extended Data Fig. 4. Cryo-EM image processing flowchart for neddylated CRL5Vif-CBFβ-ARIH2*-A3G complex.
a, Cryo-EM image processing flowchart for the complex containing ARIH2*, neddylated CRL5Vif-CBFβ, and A3G. The portion of the reconstructions corresponding to A3G-Vif-CBFβ-ELOBC is visible only at low contour. This subcomplex is presumably mobile relative to the assembly between ARIH2* and neddylated CUL5-RBX2. Masks are shown in transparent yellow surface superimposed with grey maps. b, From top to bottom: two views showing local resolution colored on the A3G consensus map for the complex containing ARIH2*, neddylated CRL5Vif-CBFβ, and A3G; Fourier Shell Correlation (FSC) curve showing the overall resolution of 3.8 Å with the FSC = 0.143 criterion; and angular orientation distribution of the final 3D reconstruction.

