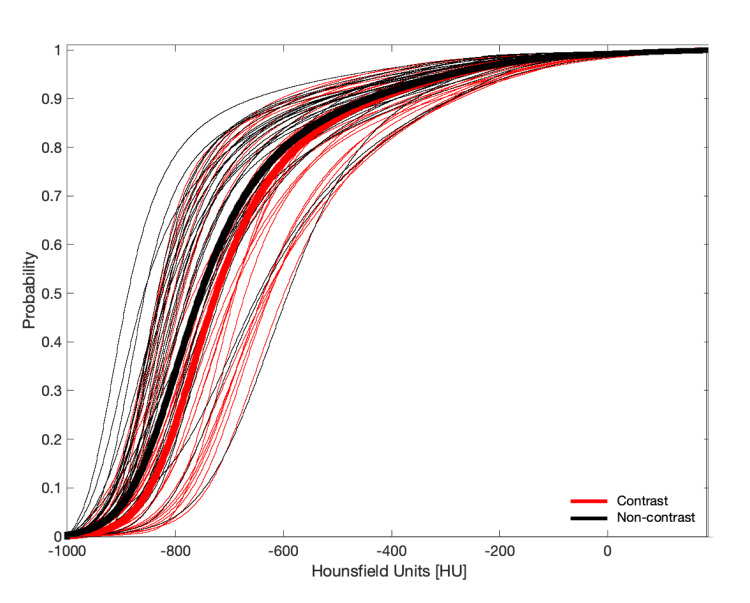
Figure 1. Average normal cumulative distribution functions of the non-COVID-19 cohort .
Bold-red curve - for patients who received contrast-enhanced CT scans; Bold-black curve - for patients who received noncontrast CT scans; Thin red and black curves - corresponding individual cumulative distribution functions of the non-COVID-19 patients
COVID-19 - Coronavirus disease 2019; CT - Computed tomography.

